· AI Technology · 14 min read
The Ultimate Guide to AI Diagram Generation (2025 Edition)
The comprehensive guide to AI diagram generators. Learn how text-to-diagram and code-to-diagram technologies are replacing manual drawing, boosting developer productivity, and creating living documentation.

The Ultimate Guide to AI Diagram Generation (2025 Edition)
Welcome to the most comprehensive guide you’ll find on AI diagram generation this year. If you’re tired of the manual drag and drop and want to understand how you can describe a system and just have a diagram appear, you’ve come to the right place. We’ll cover everything from the ground up.
Tl;Dr
Manual Diagramming is Obsolete: Tools that require you to manually place and connect every box are slow, inefficient, and a major drain on productivity for technical teams.
AI is a Paradigm Shift: AI diagram generators create visuals directly from text descriptions or by analyzing existing code. You describe it or show it the code, and it builds the diagram for you.
Key Technologies: This is all made possible by Natural Language Processing (NLP) for understanding text, code analysis for mapping repositories, and advanced layout engines like D2 that ensure every diagram looks perfect.
Massive Benefits: The main advantages are huge time savings, documentation that is always accurate because it’s tied to your code, and much clearer team collaboration.
It’s Not Just for Code: You can generate system architecture diagrams, flowcharts, sequence diagrams, and even database ERDs, making it useful for everyone from developers to product managers.
AIDiagramMaker Leads the Way: We’ll be showing examples using AIDiagramMaker, a tool designed to excel at both text to diagram and code to diagram workflows, making it a powerful alternative to manual or syntax heavy tools.
Introduction: The End of Manual Diagramming as We Know It
Let’s be honest for a moment. Think about the last time you had to create a software architecture diagram or a simple flowchart. How much of that time was spent on the actual thinking, and how much was spent just… fiddling? Dragging boxes, nudging them a few pixels to the left, resizing arrows, and fighting with the alignment tools in Lucidchart or Draw.io. It’s a universal pain point. We’ve all been there, spending hours on what feels like digital arts and crafts when we should be solving problems.
Now, imagine a different way. Imagine just describing the flow you want to see, or pointing a tool at your code repository, and watching a clean, accurate, perfectly formatted diagram build itself in seconds. This isn’t a futuristic concept anymore; it’s a paradigm shift happening right now. Artificial intelligence is here to do for diagramming what calculators did for arithmetic. It handles the tedious work so you can focus on the ideas.
The purpose of this guide is to be your single, most comprehensive resource on this new world of AI diagram generation. We’ll explore what it is, how the magic actually works, why it’s becoming essential for modern tech teams, and how you can choose the right tool for your needs. Throughout this guide, we’ll be using examples from our own tool, AIDiagramMaker, which we believe is a leading solution in this exciting space.
What Is an AI Diagram Generator? (And What It’s Not)
At its heart, an AI diagram generator is a tool that uses artificial intelligence to automatically create visual diagrams from non visual inputs. This could be a simple sentence, a block of code, or even a whole folder of files. The AI’s job is to interpret the structure, relationships, and logic from your input and translate that into a visual model.
This is fundamentally different from the tools we’ve used for years. Traditional diagramming tools are just a digital canvas. They give you the shapes, but you have to do all the work of assembling them. Then you have syntax based tools like Mermaid or PlantUML. These were a step in the right direction, introducing the idea of “diagram as code.” But they still require you to learn and write a specific, often picky, syntax. A misplaced bracket can break the whole thing.
An AI generator is the next evolution. You don’t need to be a designer, and you don’t need to learn a new coding language for diagrams. The “magic” is how the tool interprets your intent. It understands what you mean when you say “a user logs in, then the system validates their password.” It can see the classes and functions in your code and map how they connect. It takes your raw thoughts and produces a clean, readable, and professional diagram.
The Core Technologies Driving AI Diagramming
This isn’t just a simple script. A few powerful technologies work together to make this happen. Understanding them helps you appreciate just how big of a leap this is.
Natural Language Processing (NLP) for Text-to-Diagram
This is where the conversational magic comes from. When you write a prompt like, “Create a flowchart for a user login process,” Natural Language Processing is what allows the AI to understand your request. It uses sophisticated models, quite similar to the ones that power chatbots like GPT, to parse the grammar and intent of your sentence. It identifies the key entities (“user,” “system”), the actions (“logs in,” “validates”), and the conditional logic (“if valid, then…”) to build a logical structure.
Code Analysis for Code-to-Diagram
For developers, this might be the most powerful feature. An AI diagram generator can connect to a code repository and parse the source code directly. It doesn’t just read the text; it builds an abstract syntax tree to understand the actual structure of the application. It identifies classes, functions, and methods, and maps out the dependencies between them. This is how it can generate a detailed UML class diagram or a system architecture overview without you having to explain a thing. It sees the truth right in the code.
For Read More: Text-to-Diagram vs. Code-to-Diagram.
Layout and Styling Engines (The D2 Advantage)
- Generating the right boxes and arrows is only half the battle. I think we can all agree that the real challenge, the one that consumes all the time, is the layout. How do you make it look good? How do you ensure it’s readable and not a tangled mess of overlapping lines?
This is where a declarative language like D2 comes in. Many advanced AI diagram tools, including AIDiagramMaker, use D2 as their backend. The AI’s job is to understand your intent and write D2 code. Then, D2’s incredibly powerful layout engine takes over and renders a perfect diagram. It handles the alignment, spacing, and styling automatically. This separation of tasks is what ensures you get a presentation ready diagram every single time, without any manual tweaking. Read More: Understanding D2 Language and D2.
Key Benefits: Why Every Tech Team Needs an AI Diagram Generator
So, why does all this technology matter? The benefits go far beyond just saving a bit of time. It fundamentally changes team workflows for the better.
Massive Productivity Gains for Developers
Think about all the time developers spend on documentation, onboarding new team members, or just trying to explain a concept in a meeting. It adds up. Framing this in hours saved per week, it’s not uncommon for teams to reclaim 10 to 20 percent of their time that was previously lost to creating and maintaining diagrams. That’s a huge boost in productivity. It’s more time spent coding, solving problems, and shipping features.
Read More: How AI Diagram Generators Improve Developer Productivity
Always-Accurate, Living Documentation
This is probably the single most important benefit. Manual diagrams have a fatal flaw: they are almost immediately out of date. The moment a developer refactors a service or changes an API endpoint, the diagram in the wiki becomes a lie. This erodes trust in the documentation. By generating diagrams directly from the codebase, you create what’s called “living documentation.” The diagram is always a true reflection of the system’s current state. It never gets stale.
Read More: The Future of Software Documentation.
Enhanced Collaboration and Clarity
Clear diagrams are a universal language. They bridge the gap between technical and non technical stakeholders. A product manager can finally see the workflow they designed, and an engineer can clearly present their proposed architecture. When these diagrams are backed by a system that supports version control, it becomes even more powerful. You can see who changed the diagram, when, and why, creating an audit trail of your design decisions. It brings the same level of professionalism to diagramming that we expect from our code.
Read More: Diagram Revision History & Version Control.
Types of Diagrams You Can Generate with AI
A good AI diagramming tool is incredibly versatile. It’s not a one trick pony. Here are some of the most common and useful types of diagrams you can generate, complete with simple prompt examples.
System Architecture Diagrams: These are the high level blueprints of your software. They show the main components like web servers, databases, and microservices, and how they all fit together. Read More: Architecture Diagrams.
- Prompt Example: “Show a C4 diagram of a web application with a React frontend, a Node.js backend API, and a PostgreSQL database. The backend communicates with an external Stripe API for payments.” (Image of a clean architecture diagram showing the user, frontend, backend, database, and Stripe service).
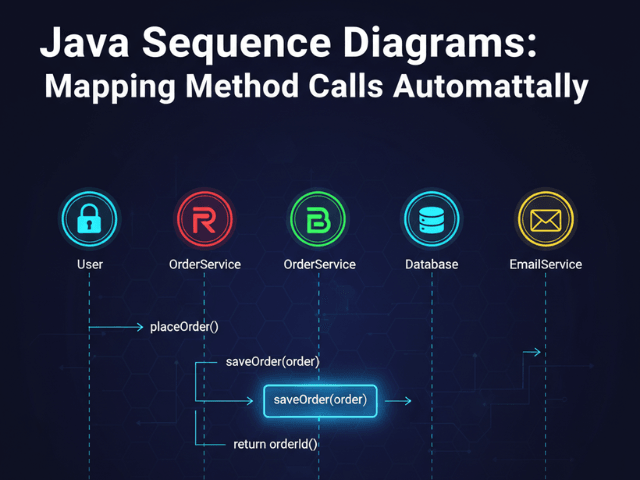
Sequence Diagrams: These are perfect for visualizing interactions over time. They show how different services or objects communicate with each other in a specific order to get something done. Read More: Sequence Diagrams.
- Prompt Example: “Create a sequence diagram of a user login. The user sends credentials to the API. The API queries the database. The Database confirms the user exists and the API returns a JWT token.” (Image of a sequence diagram with lifelines for User, API, and Database, showing the messages passed between them).
Flowcharts: The classic diagram for showing any kind of process, workflow, or decision logic. They are incredibly useful for business processes and algorithms. Read more: Flowcharts.
- Prompt Example: “Make a flowchart for a customer support ticket. The process starts when a ticket is created. A support agent checks if it is a known issue. If yes, they send a link and close the ticket. If no, they escalate to engineering.” (Image of a flowchart with a starting point, a decision diamond, and two distinct branches).
Entity-Relationship Diagrams (ERDs): Essential for database design. ERDs show the tables in your database, the columns in those tables, and the relationships (one to one, one to many) between them.
- Prompt Example: “Generate an ERD for a simple blog with a ‘users’ table and a ‘posts’ table. A user can have many posts. Include columns for user_id, username, post_id, title, and content.” (Image of an ERD with two tables, showing the columns and the “crow’s foot” notation for the one to many relationship).
UML Class Diagrams: A core diagram for object oriented programming. It visualizes the classes in a system, including their attributes, methods, and the relationships between them.
- Prompt Example: “Create a UML class diagram with a ‘Vehicle’ parent class and ‘Car’ and ‘Motorcycle’ child classes that inherit from it.” (Image of a UML diagram showing the inheritance structure).
BPMN: Business Process Model and Notation is a more formal and standardized type of flowchart used for modeling complex business workflows in a very precise way.
- Prompt Example: “Create a simple BPMN diagram for an employee expense approval process, starting with submission, then manager approval, and finally payment processing.” (Image of a BPMN diagram using the standardized shapes for tasks, gateways, and events).
Real-World Scenarios and Use Cases
The true power of this technology really shines when you see how it applies to everyday tasks. It’s not just about making pretty pictures; it’s about solving real problems.
Scenario: Documenting a Microservices Architecture
Imagine you have a dozen microservices that all talk to each other. Documenting this manually is a nightmare and it’s out of date almost instantly. With an AI tool, you can point it at your repositories and generate a complete, accurate diagram of your entire system in minutes. It’s a game changer for onboarding and maintenance. Read More: Documenting a SaaS Architecture.
Scenario: Visualizing API Flows for a New Feature
A Product Manager has an idea for a new feature. Instead of writing a long document that might get misinterpreted, they can write a few simple sentences describing the user flow and API calls. This generates a clear sequence diagram that becomes the single source of truth for the development team. Read More: Visualizing Your API Flow.
Scenario: Acing a System Design Interview
System design interviews are stressful. You’re at a whiteboard trying to talk through a complex design while drawing at the same time. A better way? Use a tool where you can verbalize your thoughts, type them as prompts, and see a clean diagram form in real time. It allows you to focus on the design, not the drawing. Read More: Converting a System Design Interview into a Diagram
Scenario: Generating Documentation from a GitHub Repo
This is perhaps the ultimate workflow. Connect the AI tool to your GitHub account and you can create an instant architectural overview of any project. It’s the pinnacle of “living documentation,” where your code is always the source of truth for your diagrams. Read More: How to Generate Diagrams from GitHub Repositories
Choosing the Best AI Diagram Generator: A Comparative Look
Not all tools are created equal. The market is evolving, and it’s important to understand the key differences.
AIDiagramMaker vs. Lucidchart/Draw.io
This is the main event: AI versus manual. With tools like Lucidchart, you are the engine. You do all the work. With a tool like AIDiagramMaker, the AI is the engine. You provide the direction, and it does the heavy lifting. If you value speed, accuracy, and automation, the AI paradigm is the clear winner for technical teams. Read More: 5 Reasons Developers Are Switching from Lucidchart
AIDiagramMaker vs. Mermaid/PlantUML
This comparison is about approach. Mermaid and PlantUML are great “diagram as code” tools, but they require you to learn and write their specific syntax. AIDiagramMaker is a “no syntax” tool. The AI writes the code for you, giving you all the benefits of version control and automation without the steep learning curve. It’s a more accessible and, I think, a more productive approach.
Key Features to Look For
When you’re evaluating a tool, here’s a quick checklist of things to consider:
Input Methods: Does it support both plain text and code analysis from files or repositories?
Export Options: Can you easily export your diagrams to standard formats like SVG, PNG, and PDF?
Version Control: Does it have a robust history feature that lets you track changes and roll back to previous versions?
Collaboration: Can you share diagrams with your team and work on them together?
AI-powered Editing: After the initial generation, can you use the AI to make edits conversationally?
Getting Started with AIDiagramMaker: Your First AI Diagram
Seeing is believing. Let’s walk through just how simple it is to create your first diagram.
Sign up for a free account. The first step is always the easiest. Just get into the tool.
Choose your input method. For this first one, let’s stick with plain text to see the NLP in action.
Write your first prompt. Type something simple and clear into the prompt box. For example: “Show a simple user login flowchart with a check for password validity.” (An animated GIF could show a user typing this exact prompt into the interface).
Watch the diagram generate. In just a few seconds, you’ll see a perfectly formed flowchart appear on the canvas. The AI will have created a start point, a process for entering credentials, a decision diamond for checking validity, and two branches for success and failure. (An animated GIF could show the canvas populating with the generated flowchart).
Try an edit. Now for the fun part. Let’s not touch the diagram. Instead, let’s type another prompt to edit it. Try: “Add a ‘Forgot Password’ branch if the password is invalid.” (An animated GIF could show the diagram intelligently adding a new path and process box based on the follow up prompt).
Just like that, you’ve created and edited a diagram without touching a single shape. That’s the core of the experience.
Conclusion: The Future is Described, Not Drawn
We’ve covered a lot of ground, but the key takeaway is simple.
AI diagramming is fundamentally changing how we visualize and document our software and systems. It saves an incredible amount of time, it dramatically improves the accuracy of our documentation by linking it directly to the source of truth, and it streamlines collaboration across teams.
This technology isn’t just an incremental improvement. It’s a leap forward. It’s about moving from a world where we spend hours manually drawing boxes to one where we simply describe our ideas and let the machine handle the rest. The future of diagramming is one where our systems are described, not drawn.
So stop dragging boxes and start describing. We invite you to try AIDiagramMaker for free today and visualize your ideas instantly.