· Glossary · 5 min read
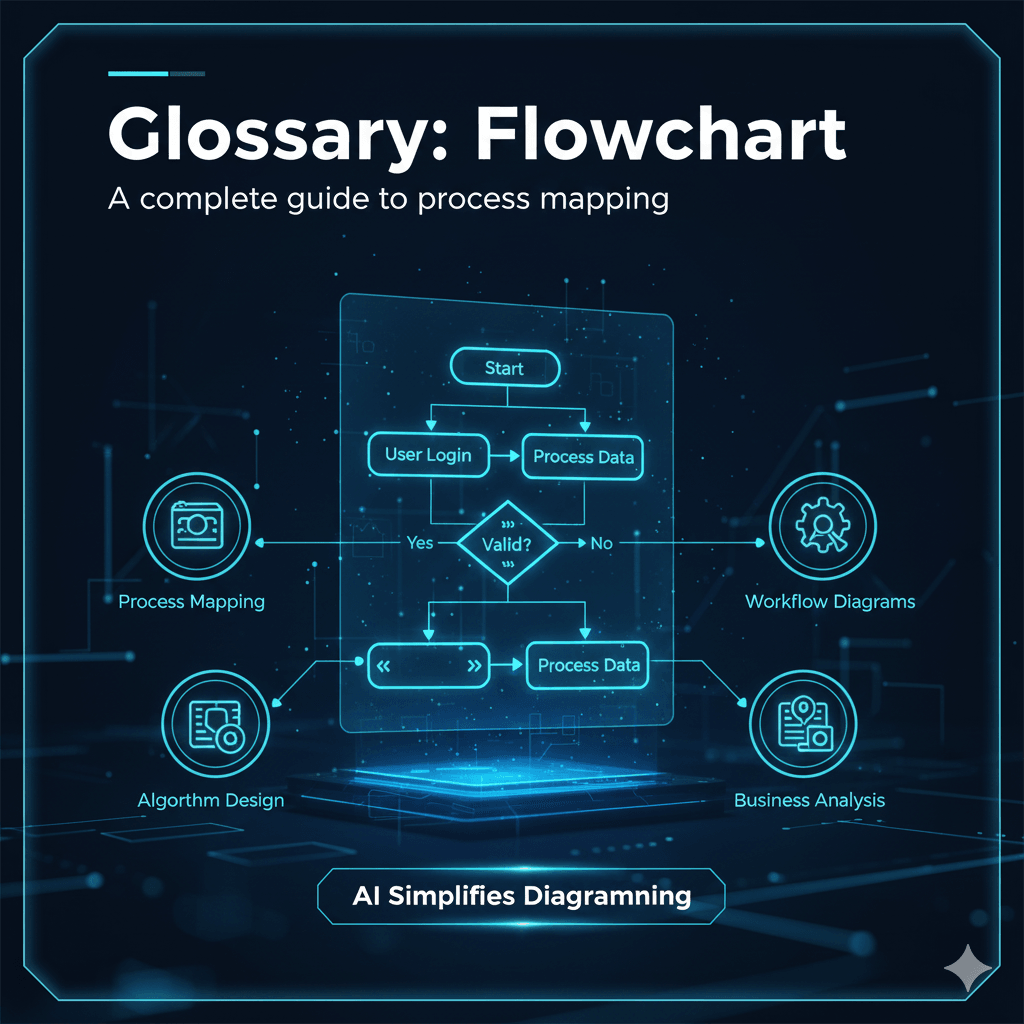
What is a Flowchart
What is the definition of a flowchart? A complete guide to the symbols, use cases, and how AI is changing the way we map processes and logic.
I remember seeing my first flowchart in a magazine quiz when I was a kid. It was probably something silly like “What kind of pizza are you?” You started at the top, answered a yes or no question, followed the line, and ended up with an answer.
It seemed simple at the time.
But as I got into software and business, I realized that these diagrams are actually the backbone of how we understand the world. Or at least, how we understand systems. Whether you are mapping out a new user registration process or just trying to decide where to go for lunch with your team, a flowchart is the most intuitive way to visualize logic.
It is one of those tools that is so common we almost take it for granted. But when you really look at how they work, you realize they are doing something quite difficult. They are turning abstract thoughts and conditions into a concrete map that anyone can follow.
TL;DR
- The Definition: A flowchart is a diagram that shows the steps of a process in sequential order.-
- The Components: It uses specific shapes like rectangles for actions and diamonds for decisions to create a universal visual language.
- The Purpose: We use them to document workflows, find bottlenecks in logic, and explain complex processes to people who might not know the technical details.
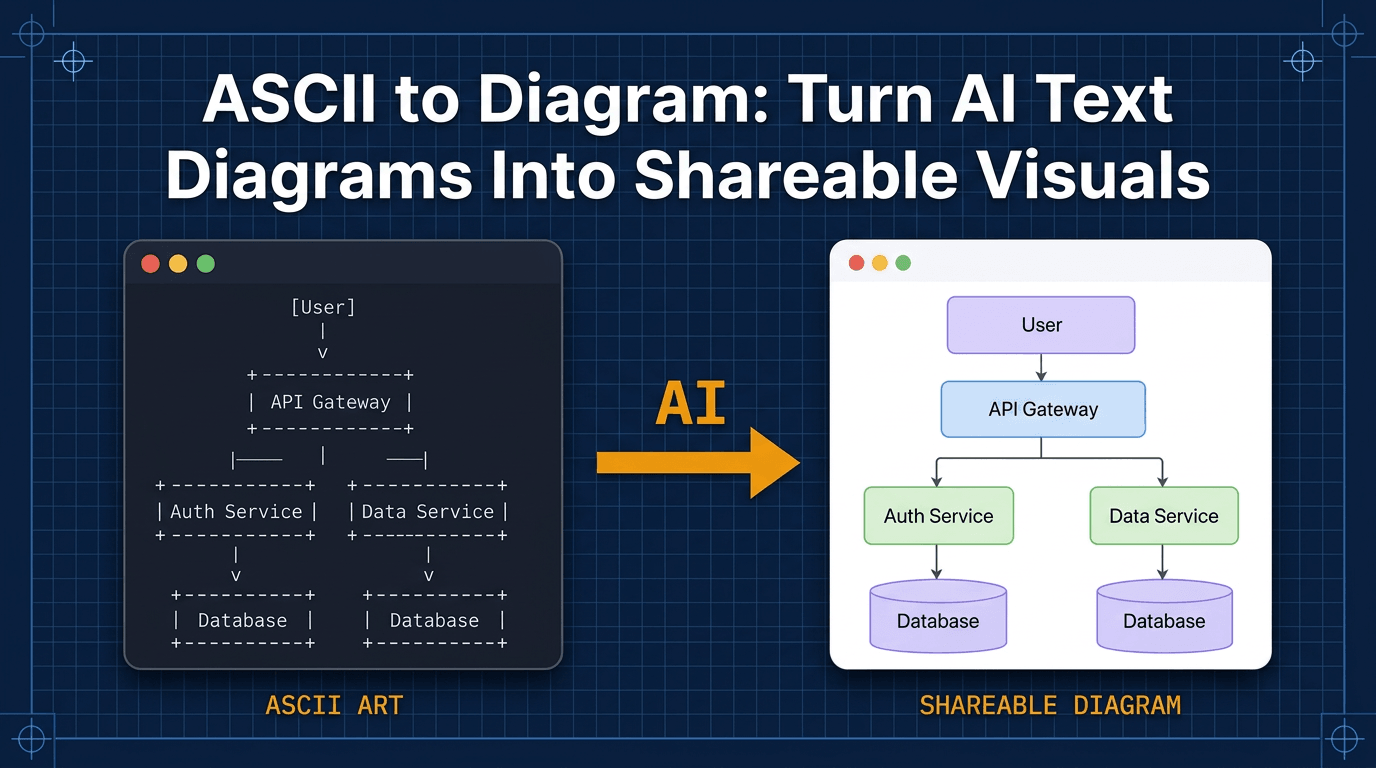
- The Modern Way: Instead of drawing them manually, you can now use AI to generate them simply by describing the logic in text.
Definition
At its simplest level, a flowchart is a visual representation of a process.
It shows the sequence of steps needed to complete a task. Think of it as a roadmap. You start at point A. You follow the path. You might hit a fork in the road where you have to make a choice. Eventually, you arrive at a destination.
In the context of software or business, we use these to document algorithms or workflows. It forces you to lay out every single step. You cannot really hide ambiguity in a flowchart. If there is a gap in your logic, the line will literally go nowhere. That is why they are so useful. They expose the holes in our thinking.
Common Flowchart Symbols
You might think you can just draw circles and squares randomly, but there is actually a standard language here. It helps if everyone uses the same shapes so we all know what is going on.
Oval or Pill Shape (The Terminator)
This represents the start or the end. It is the bread on the sandwich. Every flow needs to know where to begin and, hopefully, where it stops.
Rectangle (The Process)
This is the workhorse of the diagram. A rectangle represents an action or a task. “Send Email” or “Calculate Total” or “Bake Cake” would go in here. If you are doing something, put it in a box.
Diamond (The Decision)
This is the most important shape. A diamond indicates a question that needs to be answered. Usually, it is a yes or no question. “Is the user logged in?” or “Is the inventory empty?” The line splits here. It is what gives the flowchart its logic.
Arrow (The Flowline)
These connect everything together. They show the direction of the flow. Without the arrows, you just have a bunch of shapes floating in space.
Why Use a Flowchart?
I find that I usually start drawing these when I am confused.
If I am trying to explain a feature to a developer or a stakeholder, words often fail. I can say “the user logs in,” but what if they get the password wrong? What if the server is down?
Process Clarification
Drawing it out forces you to handle those edge cases. You cannot just wave your hands and say “it works.” You have to draw the line for “Password Incorrect” and decide where it goes. It acts as a logic check for your brain.
Communication
It is the universal language of business and tech. You can show a flowchart to a CEO or a junior engineer, and they will both understand it. It bridges the gap between the technical code and the business requirement.
Solving Problems
When a process is broken, a flowchart helps you find the break. You can trace the path and see where things are getting stuck. Maybe there is a loop that never ends. Maybe there is a decision that leads to a dead end. Visualizing it makes the bug obvious.
Create a Flowchart Instantly with AI
I will be honest. I hate drawing flowcharts manually.
It is the alignment that gets me. You spend half your time trying to get the arrows to look straight or resizing the diamonds because the text does not fit. By the time you are done making it look pretty, you have forgotten the logic you were trying to map out.
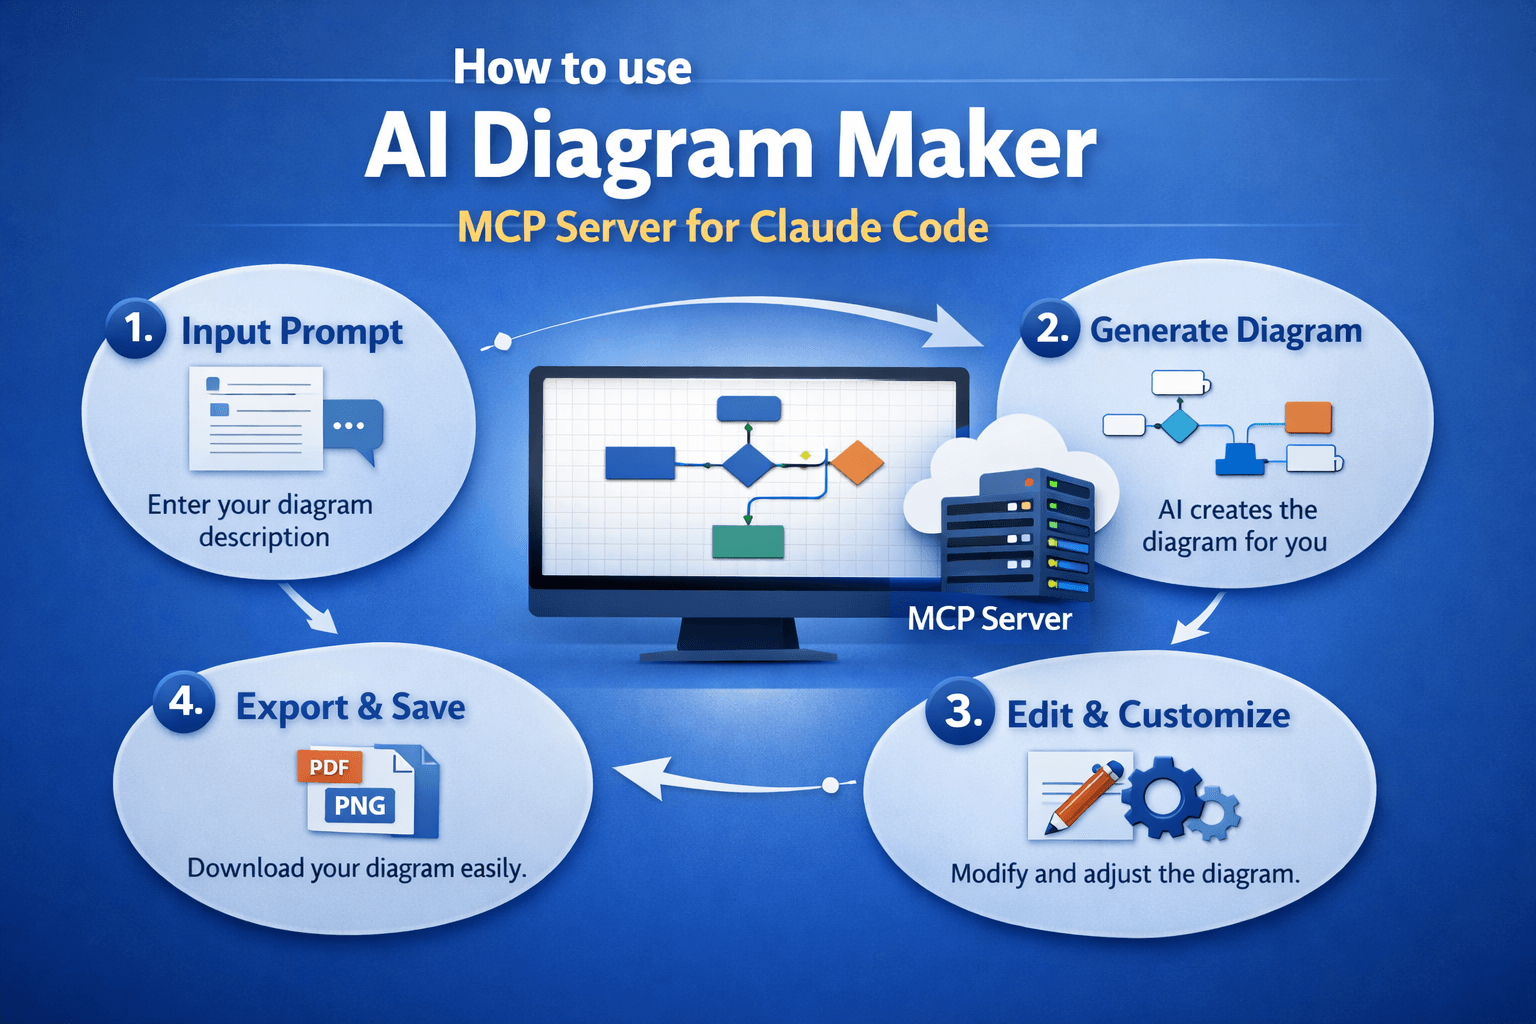
This is where tools like AIDiagramMaker come in.
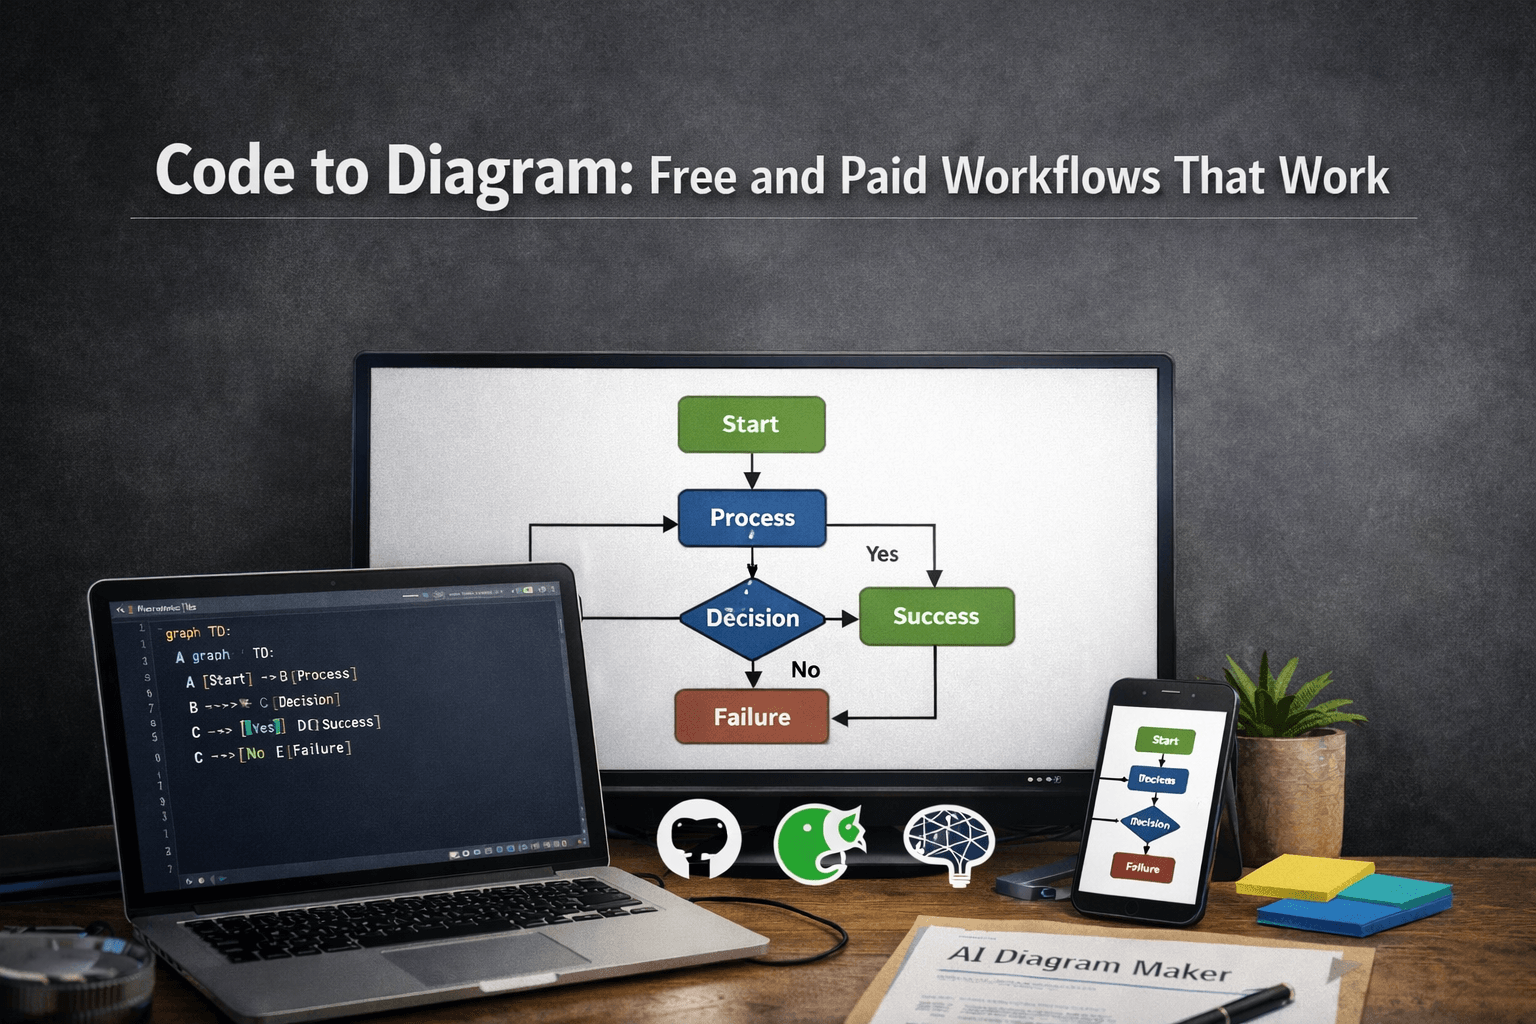
You do not need to drag shapes anymore. You can just describe the process. You type “If the user has a premium account, show the premium dashboard. Otherwise, show the upgrade banner.” The AI understands the logic. It knows that “If” means a diamond. It knows “show dashboard” is a rectangle. It draws it for you, perfectly aligned, in seconds.
See it in Action
We use flowcharts all the time to solve real problems. Here are a few examples of how you can use AI to build them.
Turning Meeting Notes into Workflow Diagrams Instantly
Take the messy notes from your standup meeting and turn them into a clear process map without drawing a single box.
The Ultimate Guide to AI Diagram Generation
Head back to the main guide to see what other types of diagrams you can generate to make your life easier.