· Interview · 4 min read
Cracking the System Design Interview: Visualizing Solutions in Real-Time
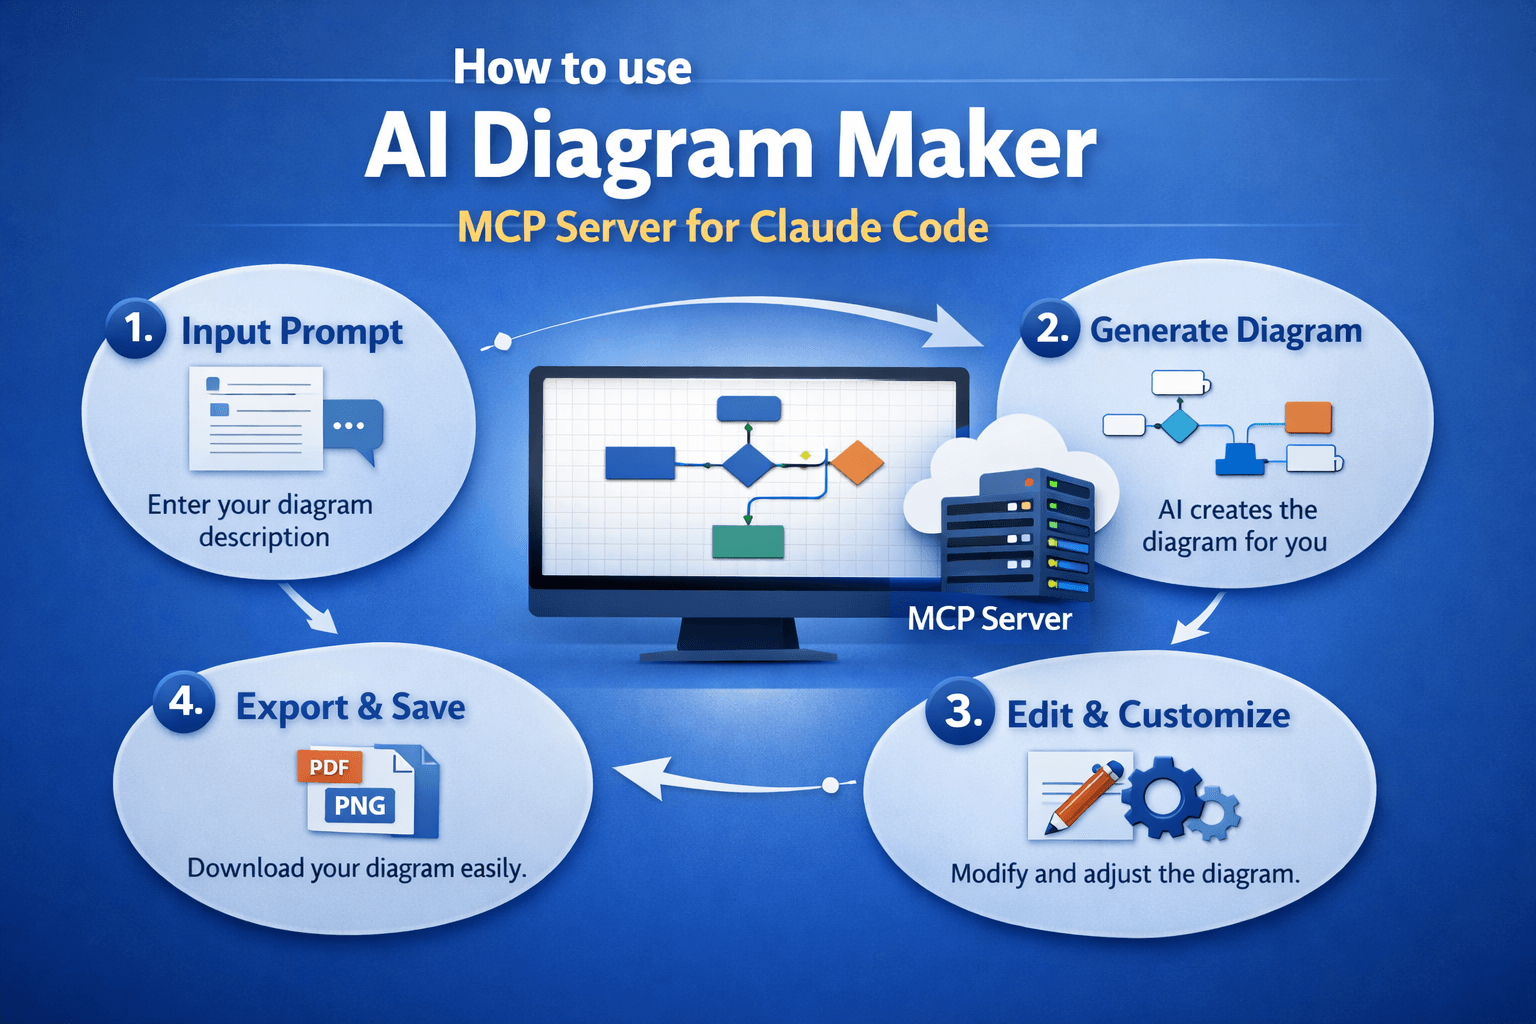
This guide explains how using a text-to-diagram tool can be your secret weapon to visualize your thoughts in real-time, giving you the speed and clarity you need to pass the interview.

You have spent months grinding LeetCode. You know how to invert a binary tree. You know dynamic programming.
But then comes the System Design round.
“Design Netflix,” the interviewer says.
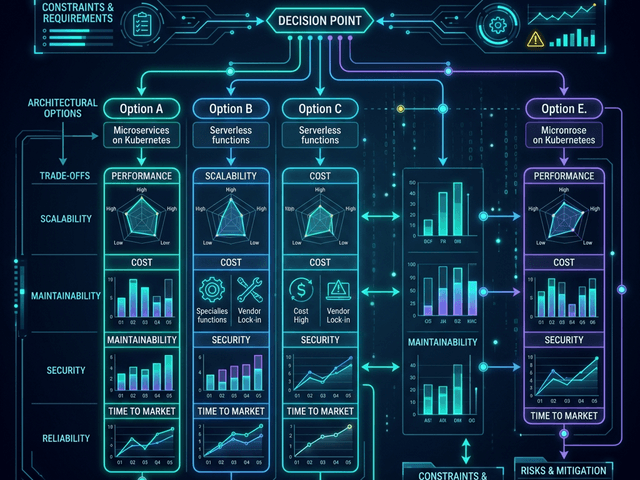
Your palms sweat. This isn’t a coding problem with a single right answer. It is an open-ended conversation about trade-offs scalability and architecture.
In a physical office you would walk up to a whiteboard. You would draw boxes. You would erase them. You would point and talk. It was messy but it was dynamic.
But now interviews are virtual. You are staring at a Zoom screen. You try to use a collaborative whiteboard tool with your mouse. You draw a wobbly square that looks like a potato. You spend thirty seconds trying to type “Load Balancer” inside it.
The flow is broken. You are fighting the tool instead of showcasing your engineering prowess.
This guide explains how using a text-to-diagram tool can be your secret weapon. It allows you to visualize your thoughts in real-time giving you the speed and clarity you need to pass the interview.
The “Whiteboard” Problem in Virtual Interviews
Virtual whiteboarding is awkward.
Struggling with Zoom whiteboards and mouse drawing
Drawing with a mouse is unnatural. It is slow. It looks unprofessional.
When you are trying to explain a complex sharding strategy while struggling to draw a straight line your brain is splitting its resources. You are devoting 50% of your cognitive load to motor skills. That is 50% less brainpower for solving the actual problem.
The interviewer sees a candidate who is slow and disorganized. They don’t see the brilliant architect underneath the bad MS Paint skills.
Strategy: Text-to-Diagram as Your Secret Weapon
Imagine if you could just type your design.
Speed: Generating a Load Balancer + DB setup in 10 seconds
With AI Diagram Maker you can type: “Client connects to Load Balancer. Load Balancer connects to 3 Web Servers.”
In seconds you have a clean professional diagram on your screen. You can share your screen with the interviewer. They watch you type. They see the diagram appear. “Wow,” they think. “This candidate is fast.”
Clarity: Standardized shapes vs. messy hand-drawing
The diagram uses standard geometric shapes. It is legible. It is aligned.
It shows that you value clear communication. System design is largely about communication. If your diagram is clear your ideas are clear.
Walkthrough: Designing “Design Twitter” Live
Let’s walk through how you would actually use this in a 45-minute interview.
Prompt 1: High-level read/write path
The interviewer asks you to handle the high-level flow. You say: “Okay let’s start with the write path.”
You type: “User posts tweet to API Gateway. API Gateway writes to Tweet Service. Tweet Service saves to Database.” The diagram generates. You point to it. “This works for low traffic. But for reads we need to optimize.”
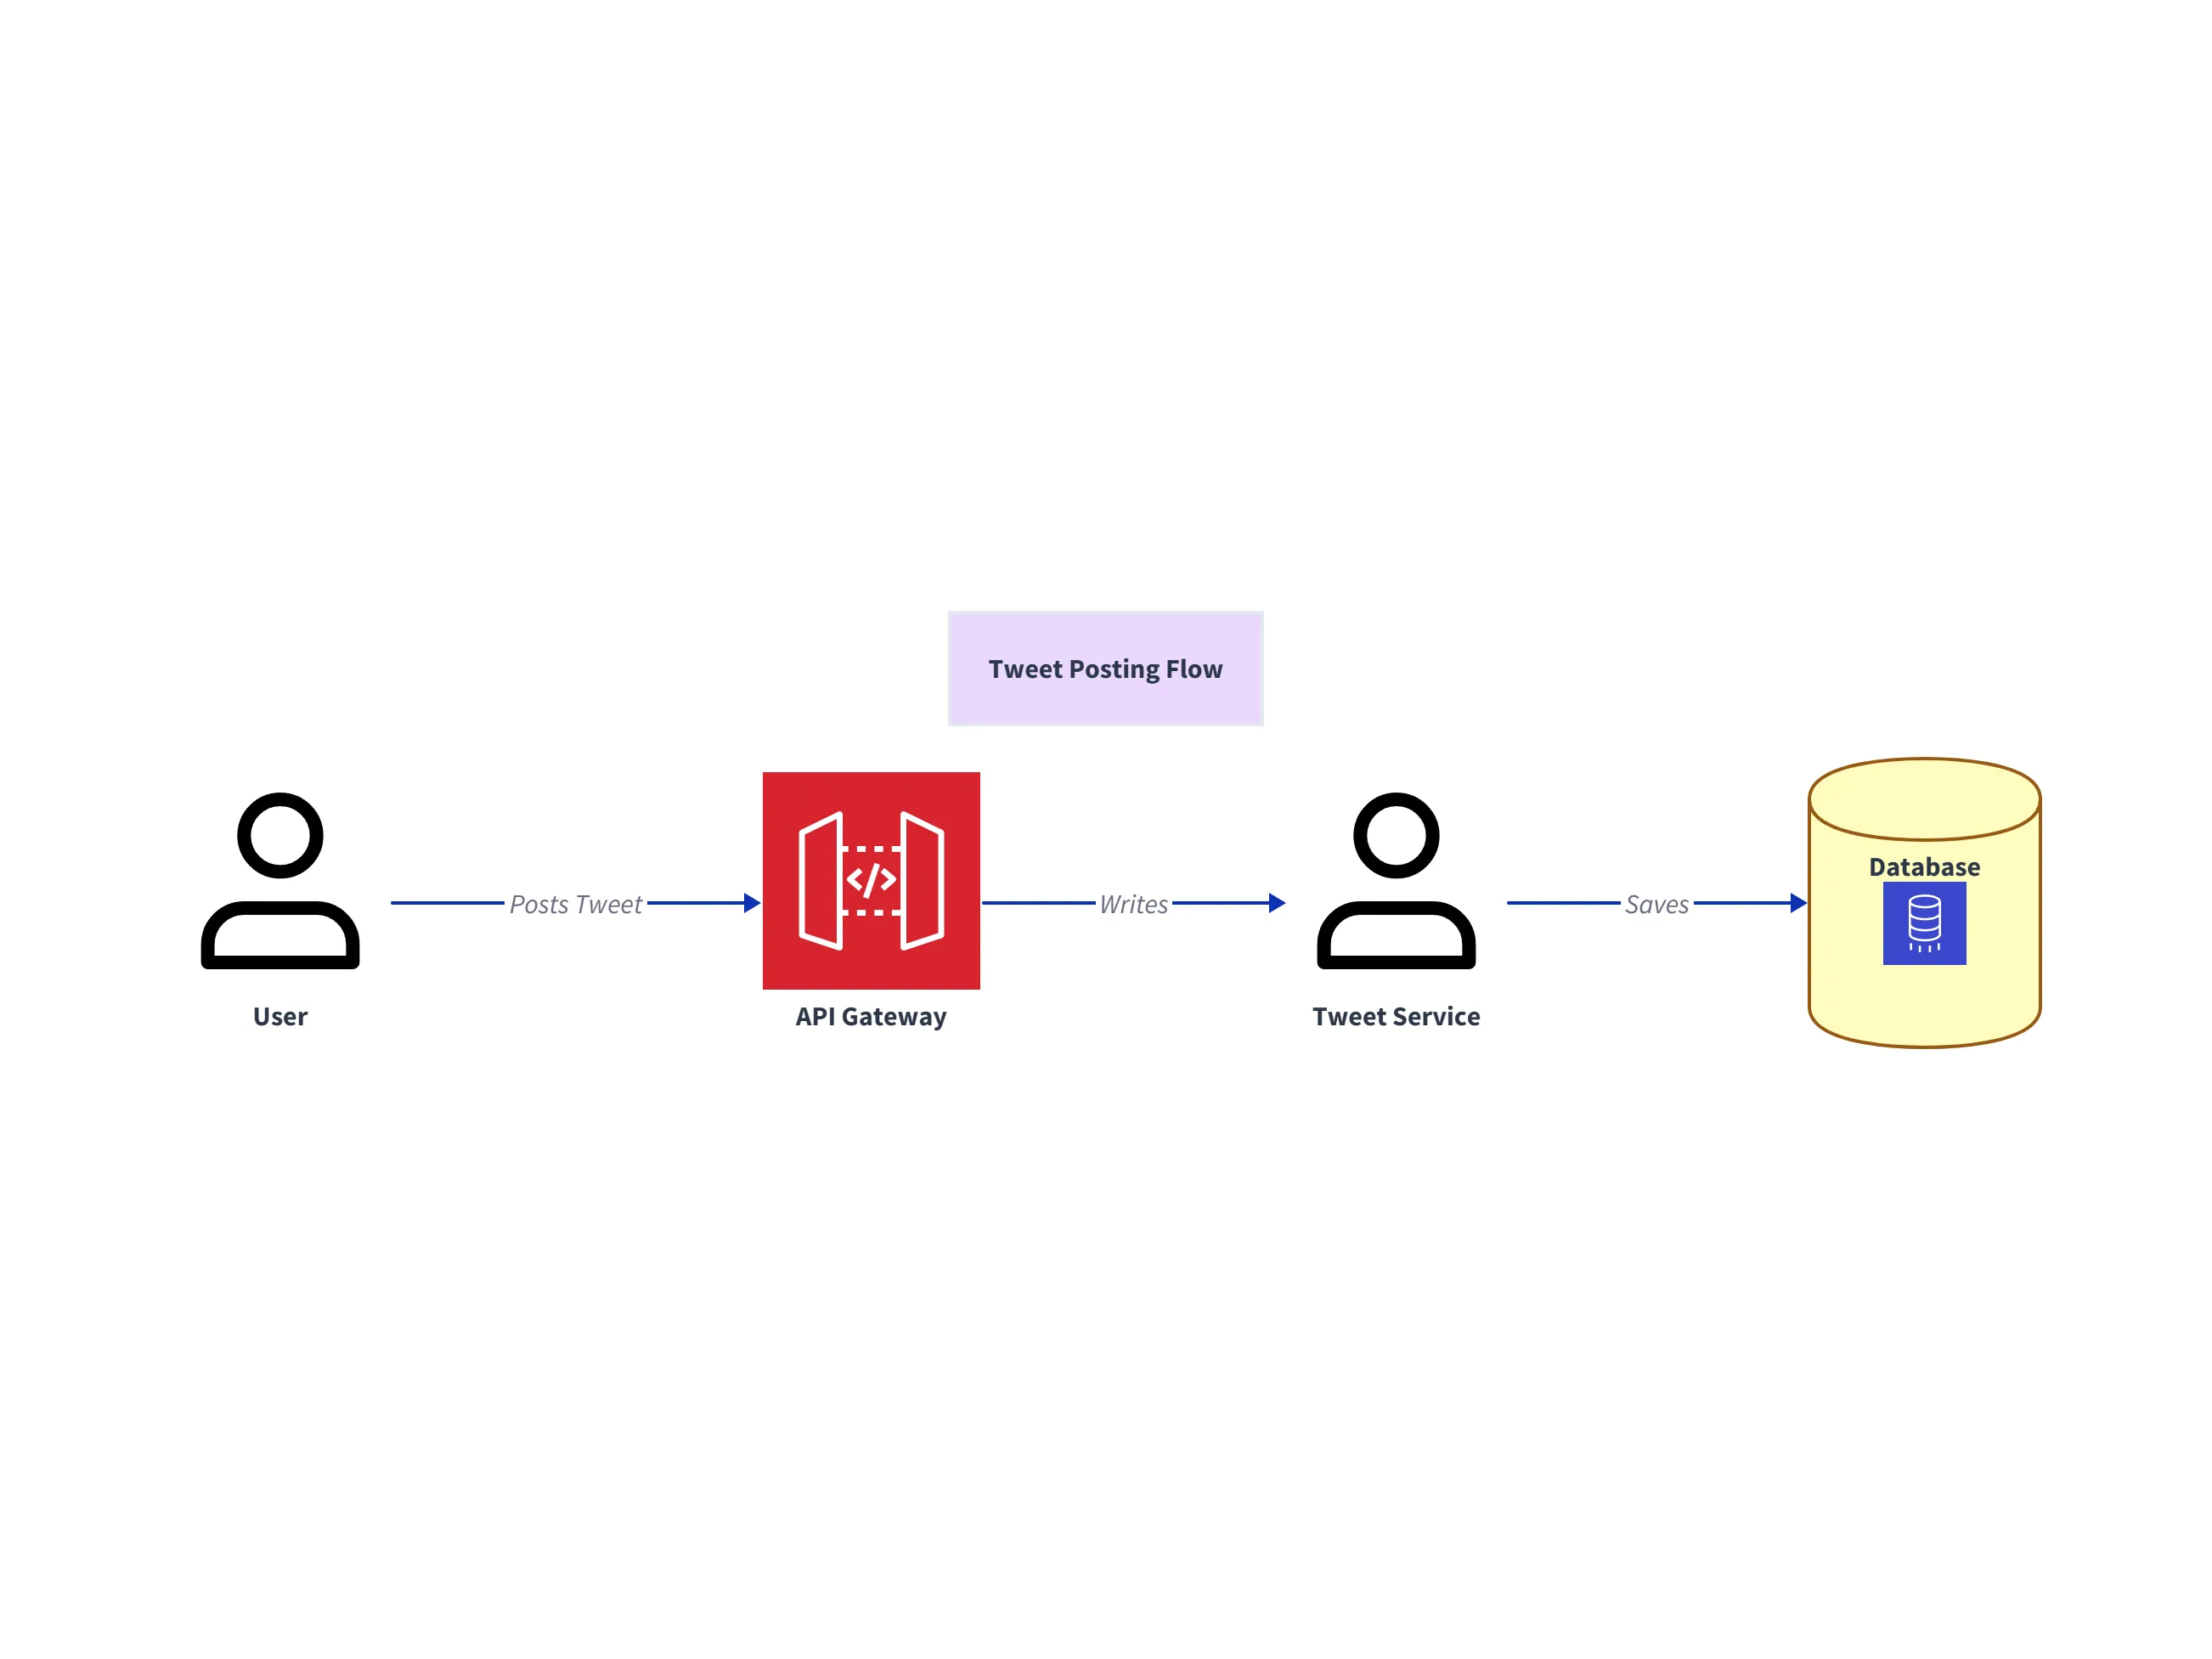
This first diagram establishes the baseline architecture: user writes flow through API Gateway into Tweet Service and then persistence in the primary database.
Prompt 2: Adding the “Fanout Service” and “Redis Cache”
You explain: “When a celebrity tweets we need to fan out that tweet to millions of followers. Reading from the DB will be too slow.”
You update the prompt: “Tweet Service writes to Fanout Service. Fanout Service pushes to Redis Cache. User reads from Redis.” The diagram updates. You have visually introduced complexity only when it was needed. You are storytelling with the diagram.
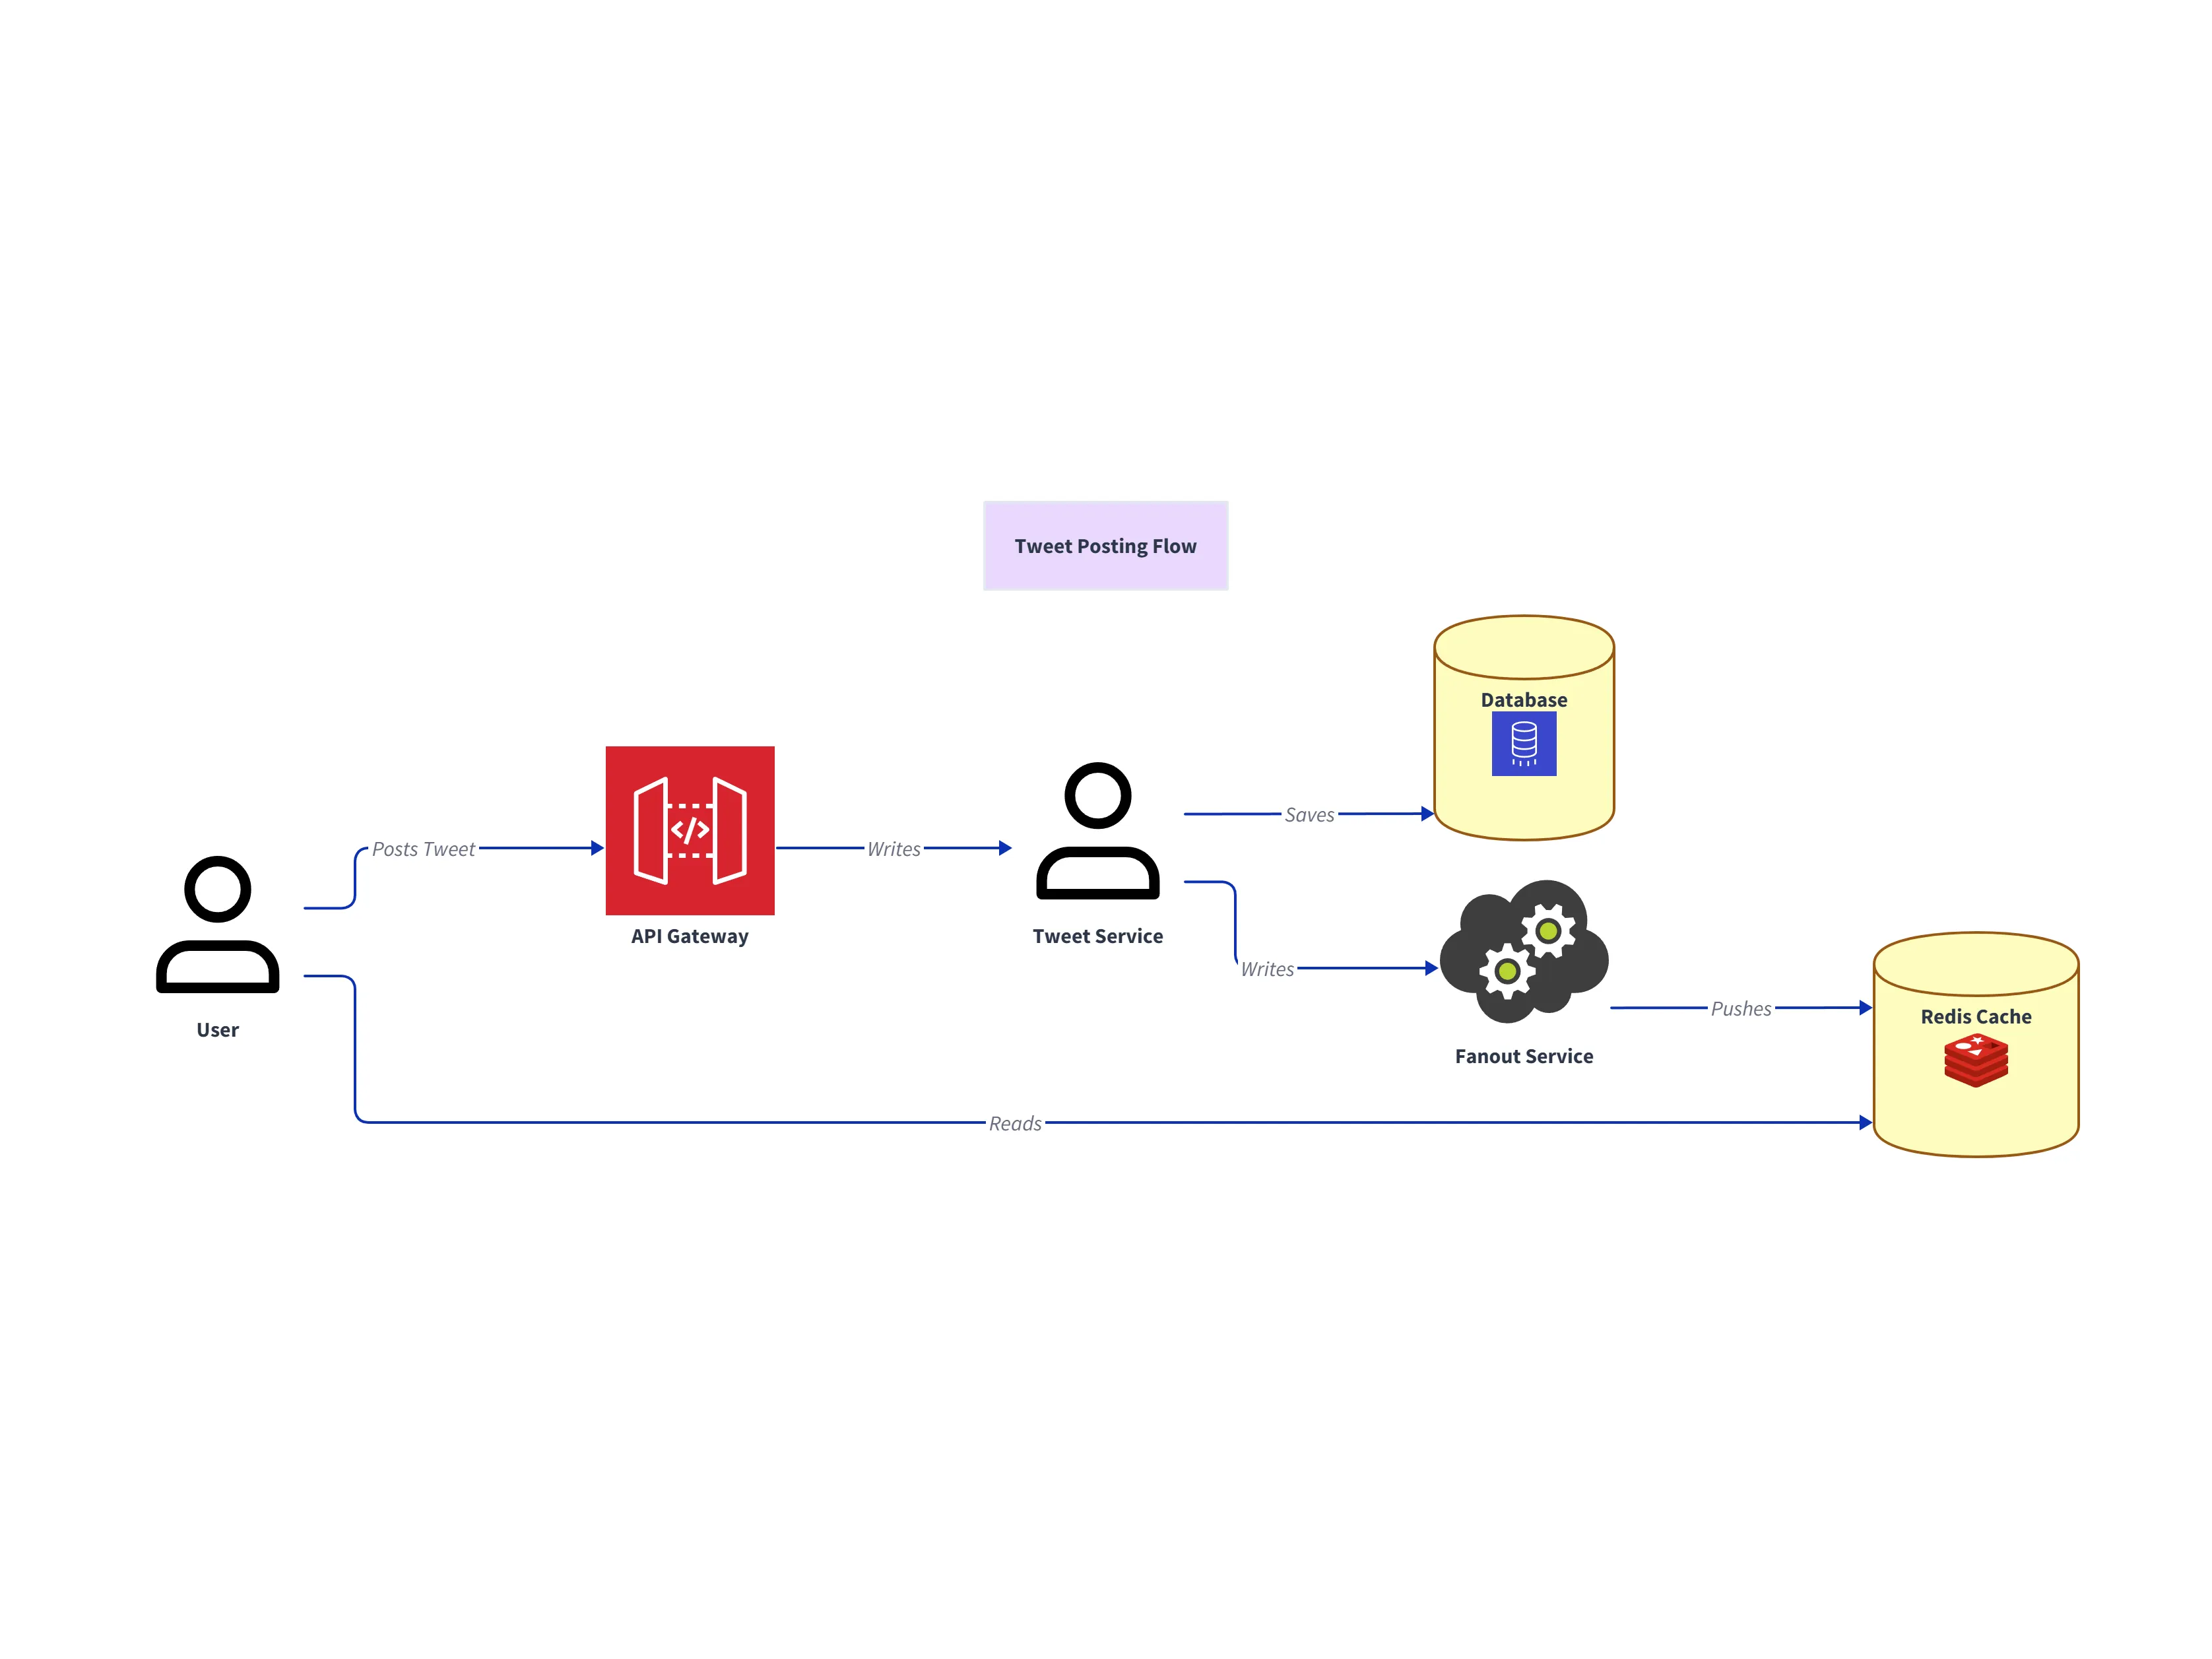
This second diagram shows the scale-ready read path: a Fanout Service pushes updates to Redis, so users read from cache instead of overloading the database.
Prompt 3: Sharding the Database
The interviewer asks: “What happens when we hit 500 million users?” You say: “We need to shard.”
You update the diagram text to label the database: “Sharded Database Cluster (Shard Key: UserID).” The visual label confirms you have answered the scalability question.
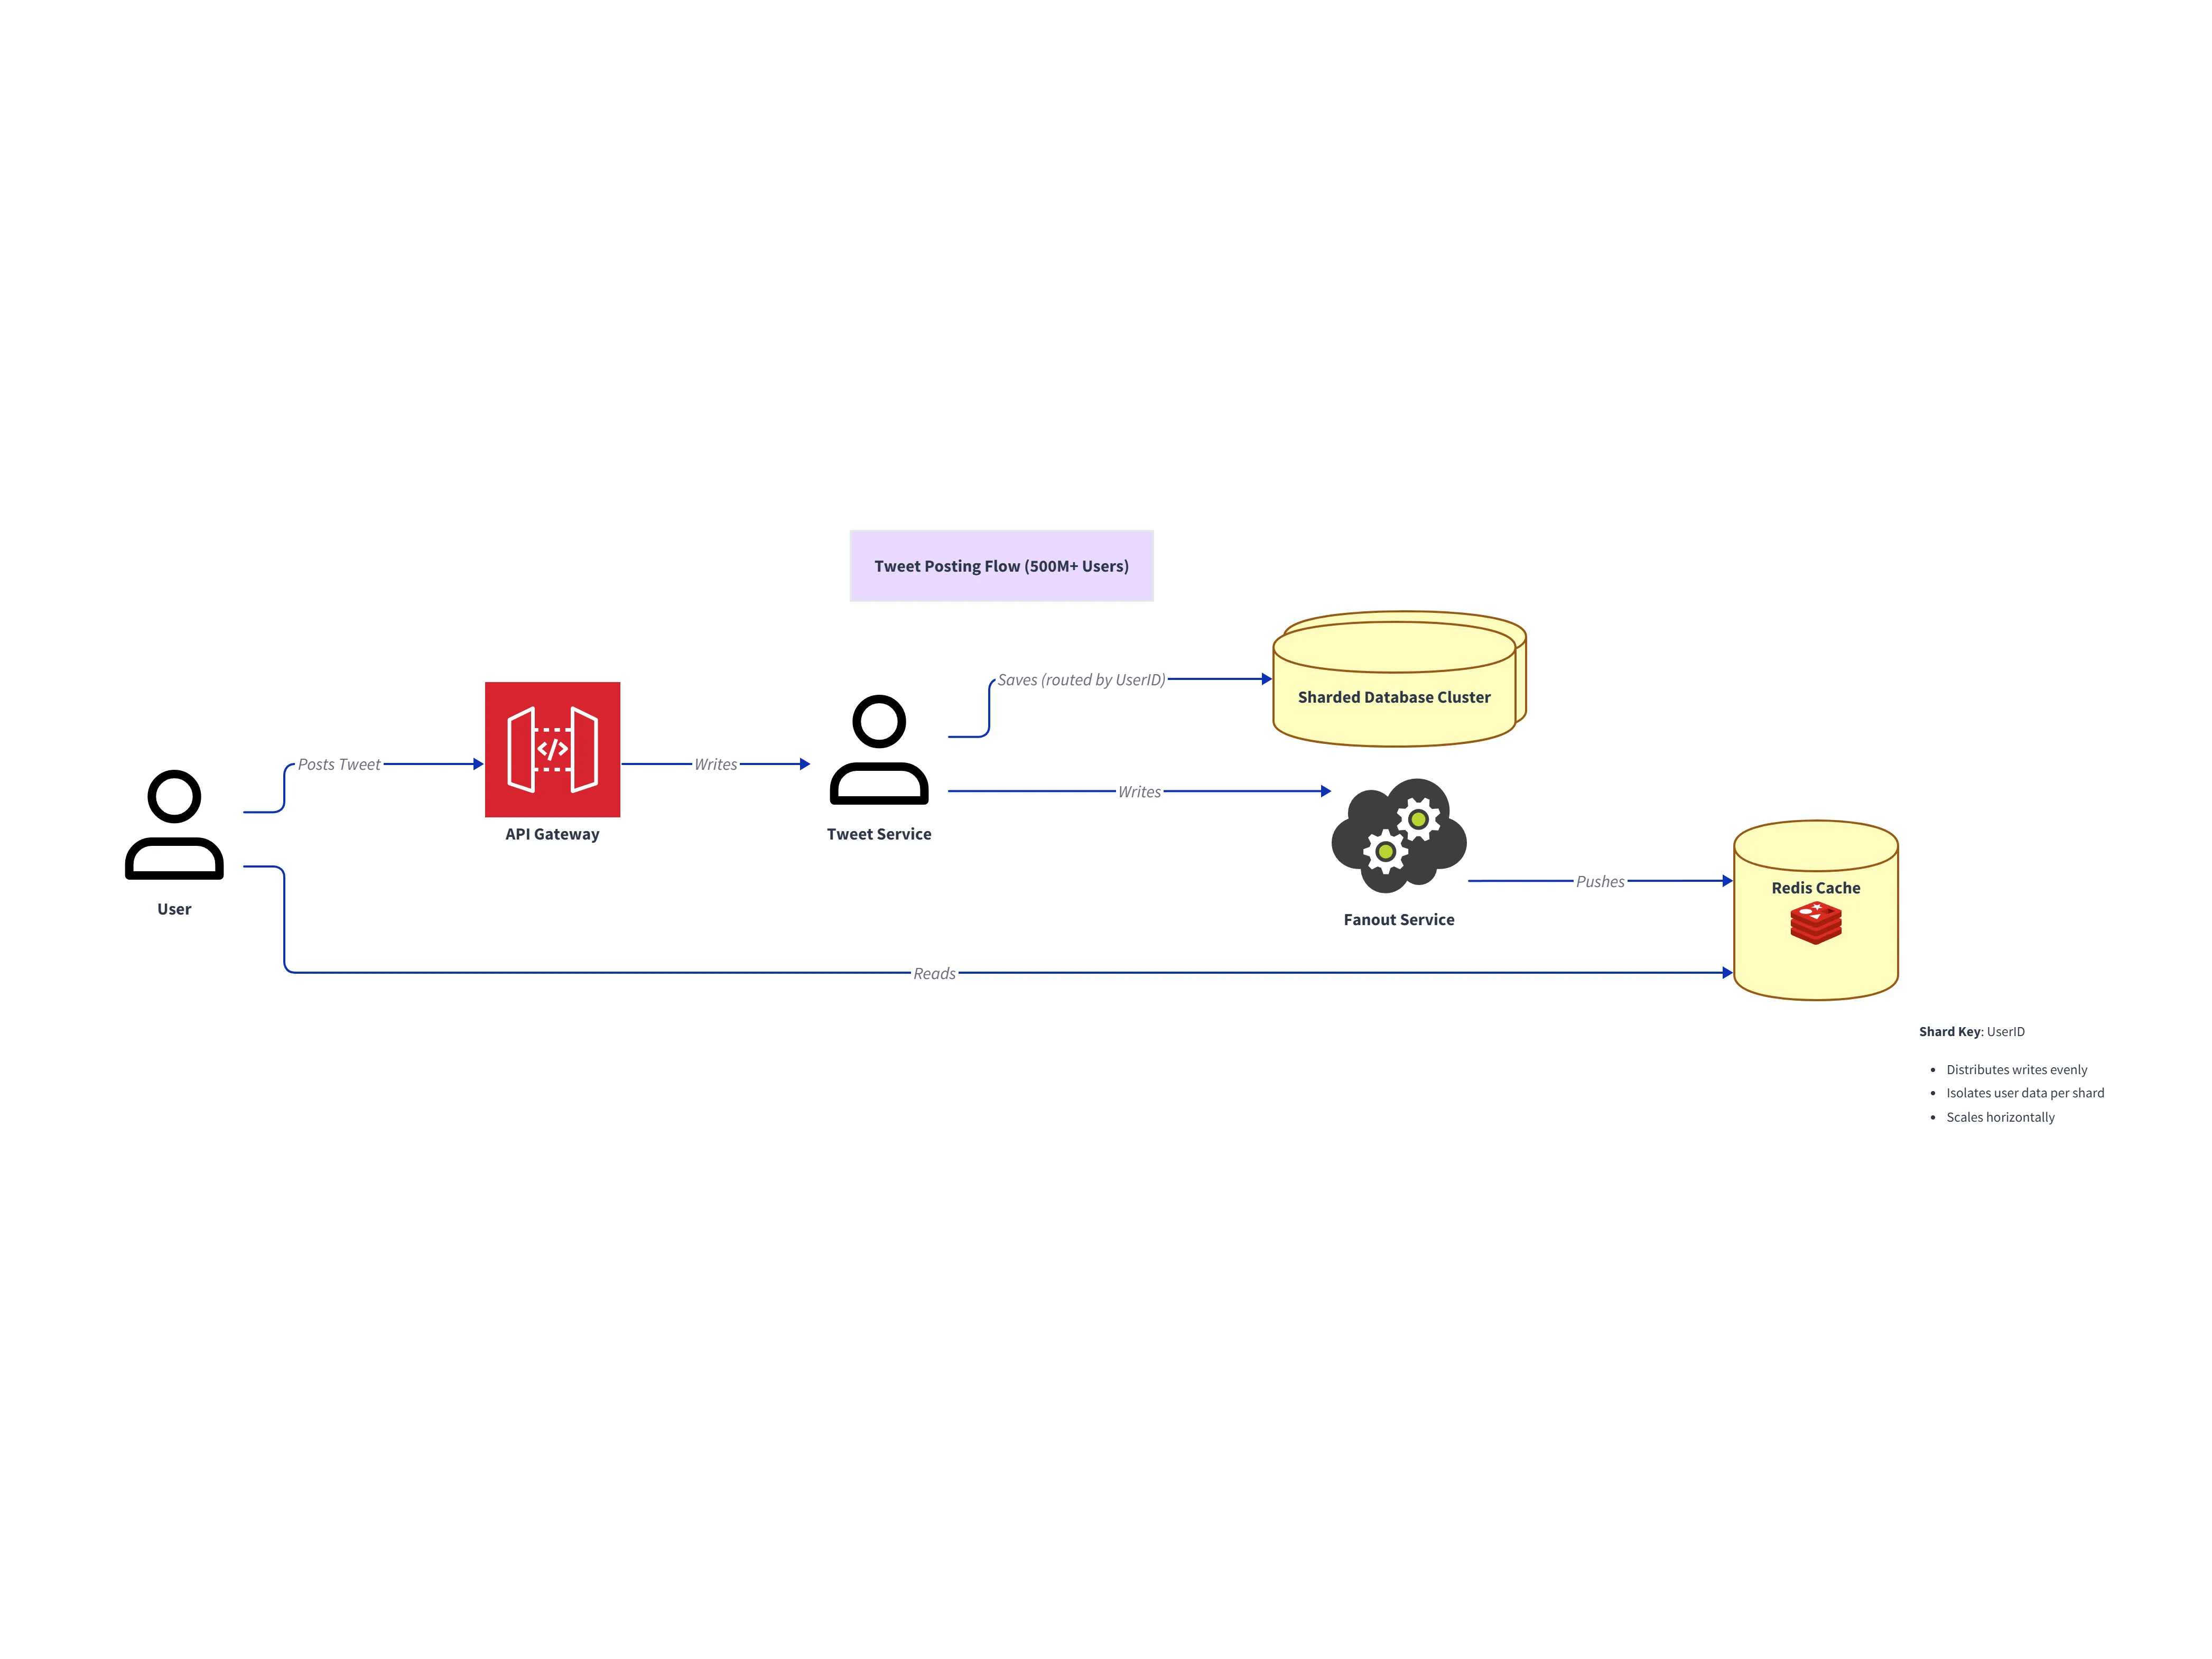
This final diagram communicates horizontal scale clearly by replacing a single database with a sharded cluster, making your scalability answer concrete and reviewer-friendly.
Tips for Communicating Your Design
Using the tool is just part of the performance.
Using the diagram to guide the conversation
Use the diagram as your anchor. When the interviewer asks a question point to the specific box.
“If this Cache fails,” you say highlighting the Redis box, “then the load falls back to the DB.” It keeps the conversation focused. It prevents you from rambling.
Exporting the visual for your portfolio/take-home
Sometimes you have a “Take Home” system design assignment.
Instead of submitting a wall of text create a professional diagram. Export it as an SVG. Embed it in your PDF. It shows that you treat documentation seriously. It makes your submission stand out from the pile of Word documents.
In the high-pressure environment of an interview every advantage counts. Stop drawing potatoes. Start generating architectures.