· Scenarios & Use Cases · 6 min read
Visualizing Your API Flow Using AI Diagrams
Stop getting lost in a rabbit hole of function calls. Learn how to use an AI API diagram generator to visualize complex request flows and sequence diagrams in seconds.

If you’re a developer, you’ve definitely done this. You’re trying to understand a new part of the codebase, and you find yourself in a rabbit hole of function calls. You see an API call being made, so you jump to that service’s code to see what it does. Then you see that service calls another API, and so on. Before you know it, you have ten tabs open, and you’ve completely lost the plot. The sequence of events is invisible, buried under layers of code. A visual would make it all so simple, but who has the time to draw that?
Tl;dr
In a hurry? Here is the main idea. Understanding the sequence of API calls from code alone is hard. A sequence diagram is the perfect tool to visualize this, but making them manually is slow and tedious. With an AI diagramming tool, you can simply describe the API interaction step by step in plain English. The tool instantly generates a perfect, professional sequence diagram for you. It’s the fastest way to document, debug, or design API flows.
Introduction: The Problem with Invisible API Calls
Trying to explain or understand a chain of API calls can be a surprisingly abstract task. You can read the OpenAPI documentation, you can look at the code, you can even inspect the network calls in your browser. But none of those things give you a clear, high level picture of the conversation happening between different services. Who talks first? Who do they talk to next? What information is passed back?
This is especially true in a world of microservices, where a single click in a user interface can trigger a cascade of calls across a dozen different systems. A visual diagram, specifically a sequence diagram, makes these invisible interactions instantly clear. This article is a quick, practical guide to creating one in just a few moments using natural language.
The Scenario: A User Authentication API Flow
To make this a real world example, we’ll diagram one of the most common interactions in web development: a standard user authentication flow using JWT, or JSON Web Tokens.
The sequence of events is pretty standard.
- The client application sends a username and password to a /login endpoint.
- An Authentication Service receives the request and checks the credentials against a User Database.
- Assuming the credentials are valid, the Auth Service generates a unique JWT token.
- The service then returns this token to the client.
- The client can now store this token and use it to make authenticated requests to other parts of the application.
Let’s visualize this.
Generating the Sequence Diagram with a Single Prompt
A sequence diagram is absolutely the perfect format for this kind of interaction. Read more: Sequence Diagram Glossary Guide. It’s specifically designed to show how different components, or “lifelines,” interact over a period of time.
The Prompt
The beauty of an AI powered tool is that you don’t need to know the complex syntax for creating a sequence diagram. You just need to describe the steps, one by one, in a clear and logical way.
Prompt Example: “Create a sequence diagram for an API authentication flow. A Client makes a POST request to an Authentication Service’s /login endpoint. The Auth Service then sends a query to the User Database to validate the credentials. The Database returns the user data. The Auth Service then generates a JWT token and returns it to the Client.”
The Output
After you enter that prompt, the tool gets to work. In a few seconds, it will generate a perfectly formatted sequence diagram. You’ll see the three “lifelines” it created automatically: one for the Client, one for the Authentication Service, and one for the User Database. You’ll also see the horizontal arrows representing the messages, the API calls and responses, all arranged in the correct chronological order from top to bottom. It’s clean, it’s accurate, and it took almost no effort.
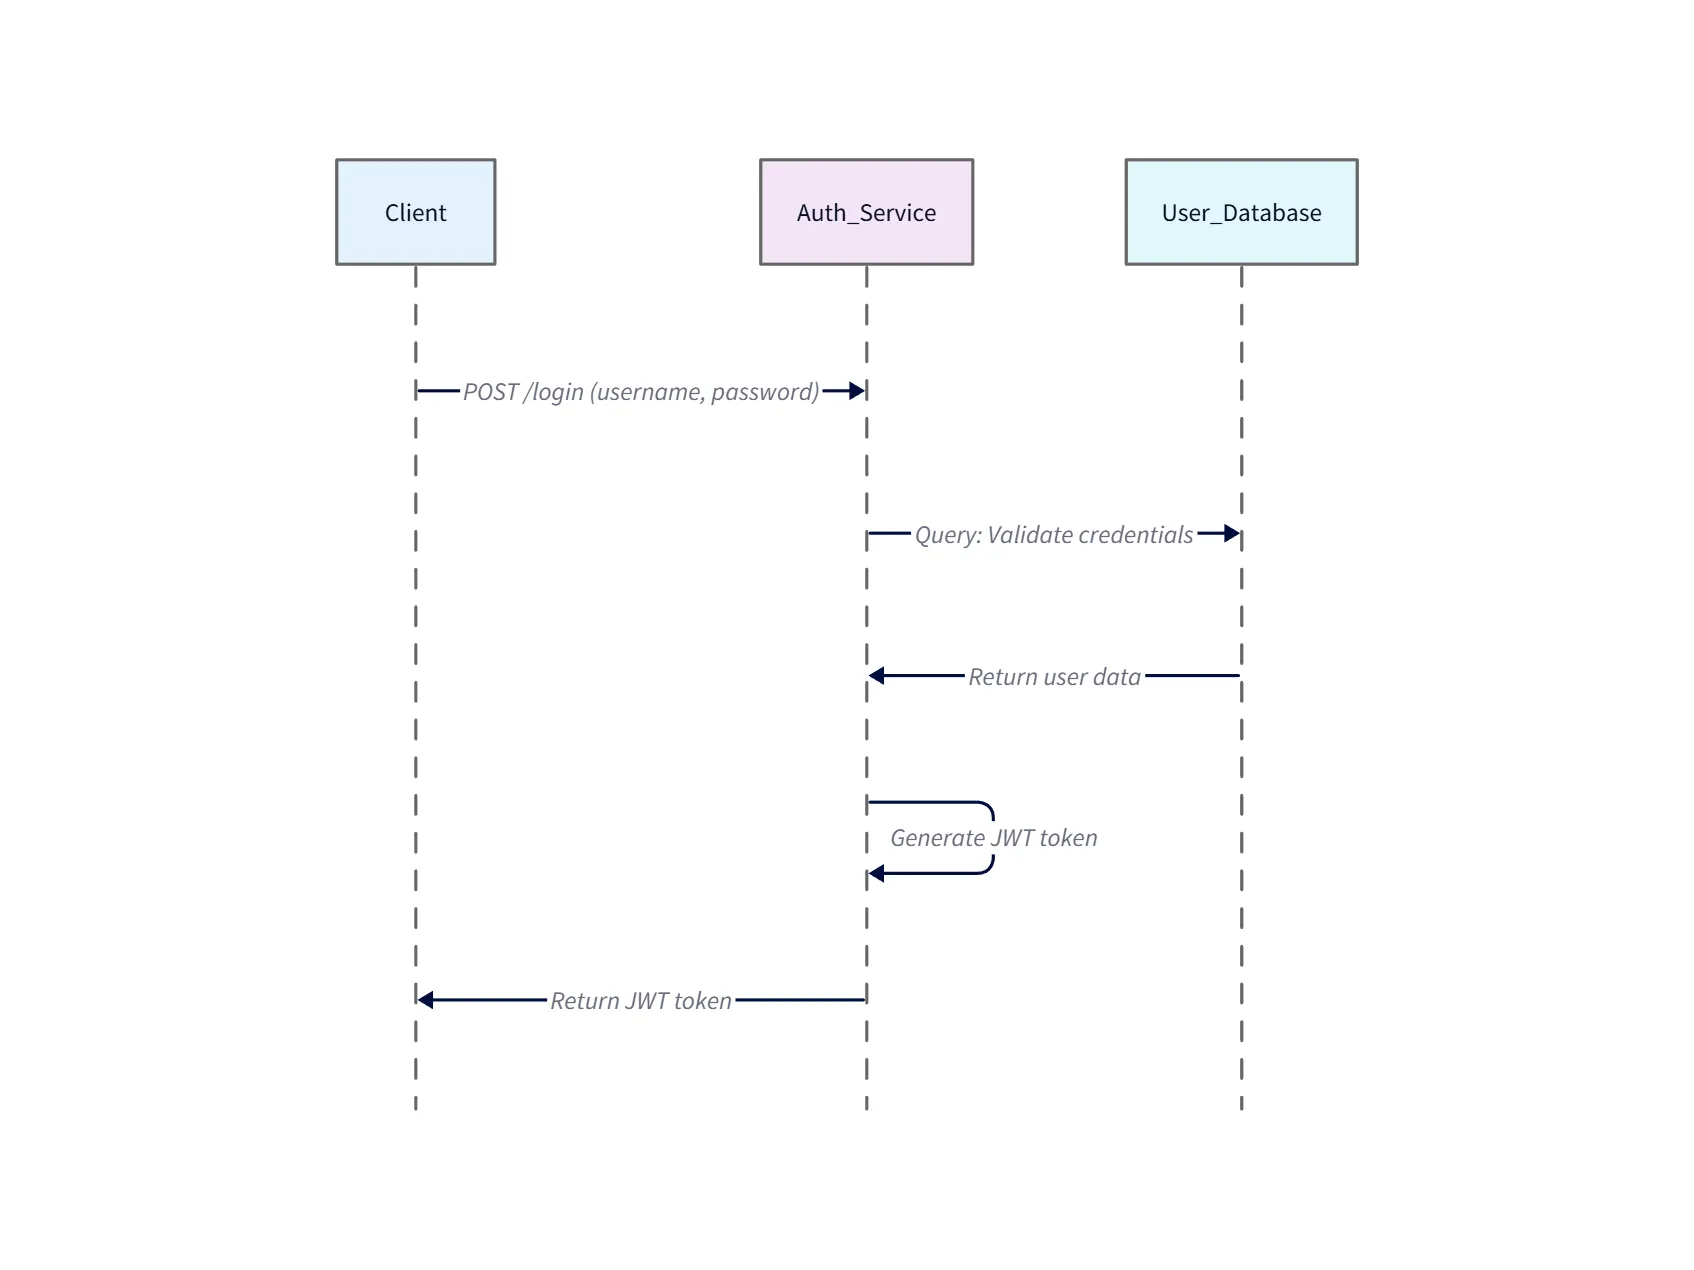
Diagram explanation
- Client → Auth Service (/login): The client submits credentials to the
/loginendpoint. This is the entry point for authentication requests. - Auth Service → User Database (validate): The Auth Service queries the User Database to verify the username/password and fetch any needed user metadata.
- User Database → Auth Service (user data): The database returns the user record (or an error if not found/invalid). The diagram shows this as the synchronous response.
- Auth Service (generate JWT): On successful validation the Auth Service creates a signed JWT (or session token) containing claims used for later authorization checks.
- Auth Service → Client (token): The JWT is returned to the client, which stores it (e.g., localStorage or cookie) and includes it in the
Authorizationheader for subsequent requests.
Use this diagram to trace the authentication handshake, identify where to add logging and rate limiting, and to show where token validation or revocation hooks should be implemented.
Expanding the Diagram for Subsequent Authenticated Requests
But what about the next step? The whole point of getting a token is to use it. A great diagramming tool should make it easy to add to your work.
Let’s continue our scenario. The user is now logged in, and they want to view their profile page. You can add this second interaction to your existing diagram with a simple follow up prompt.
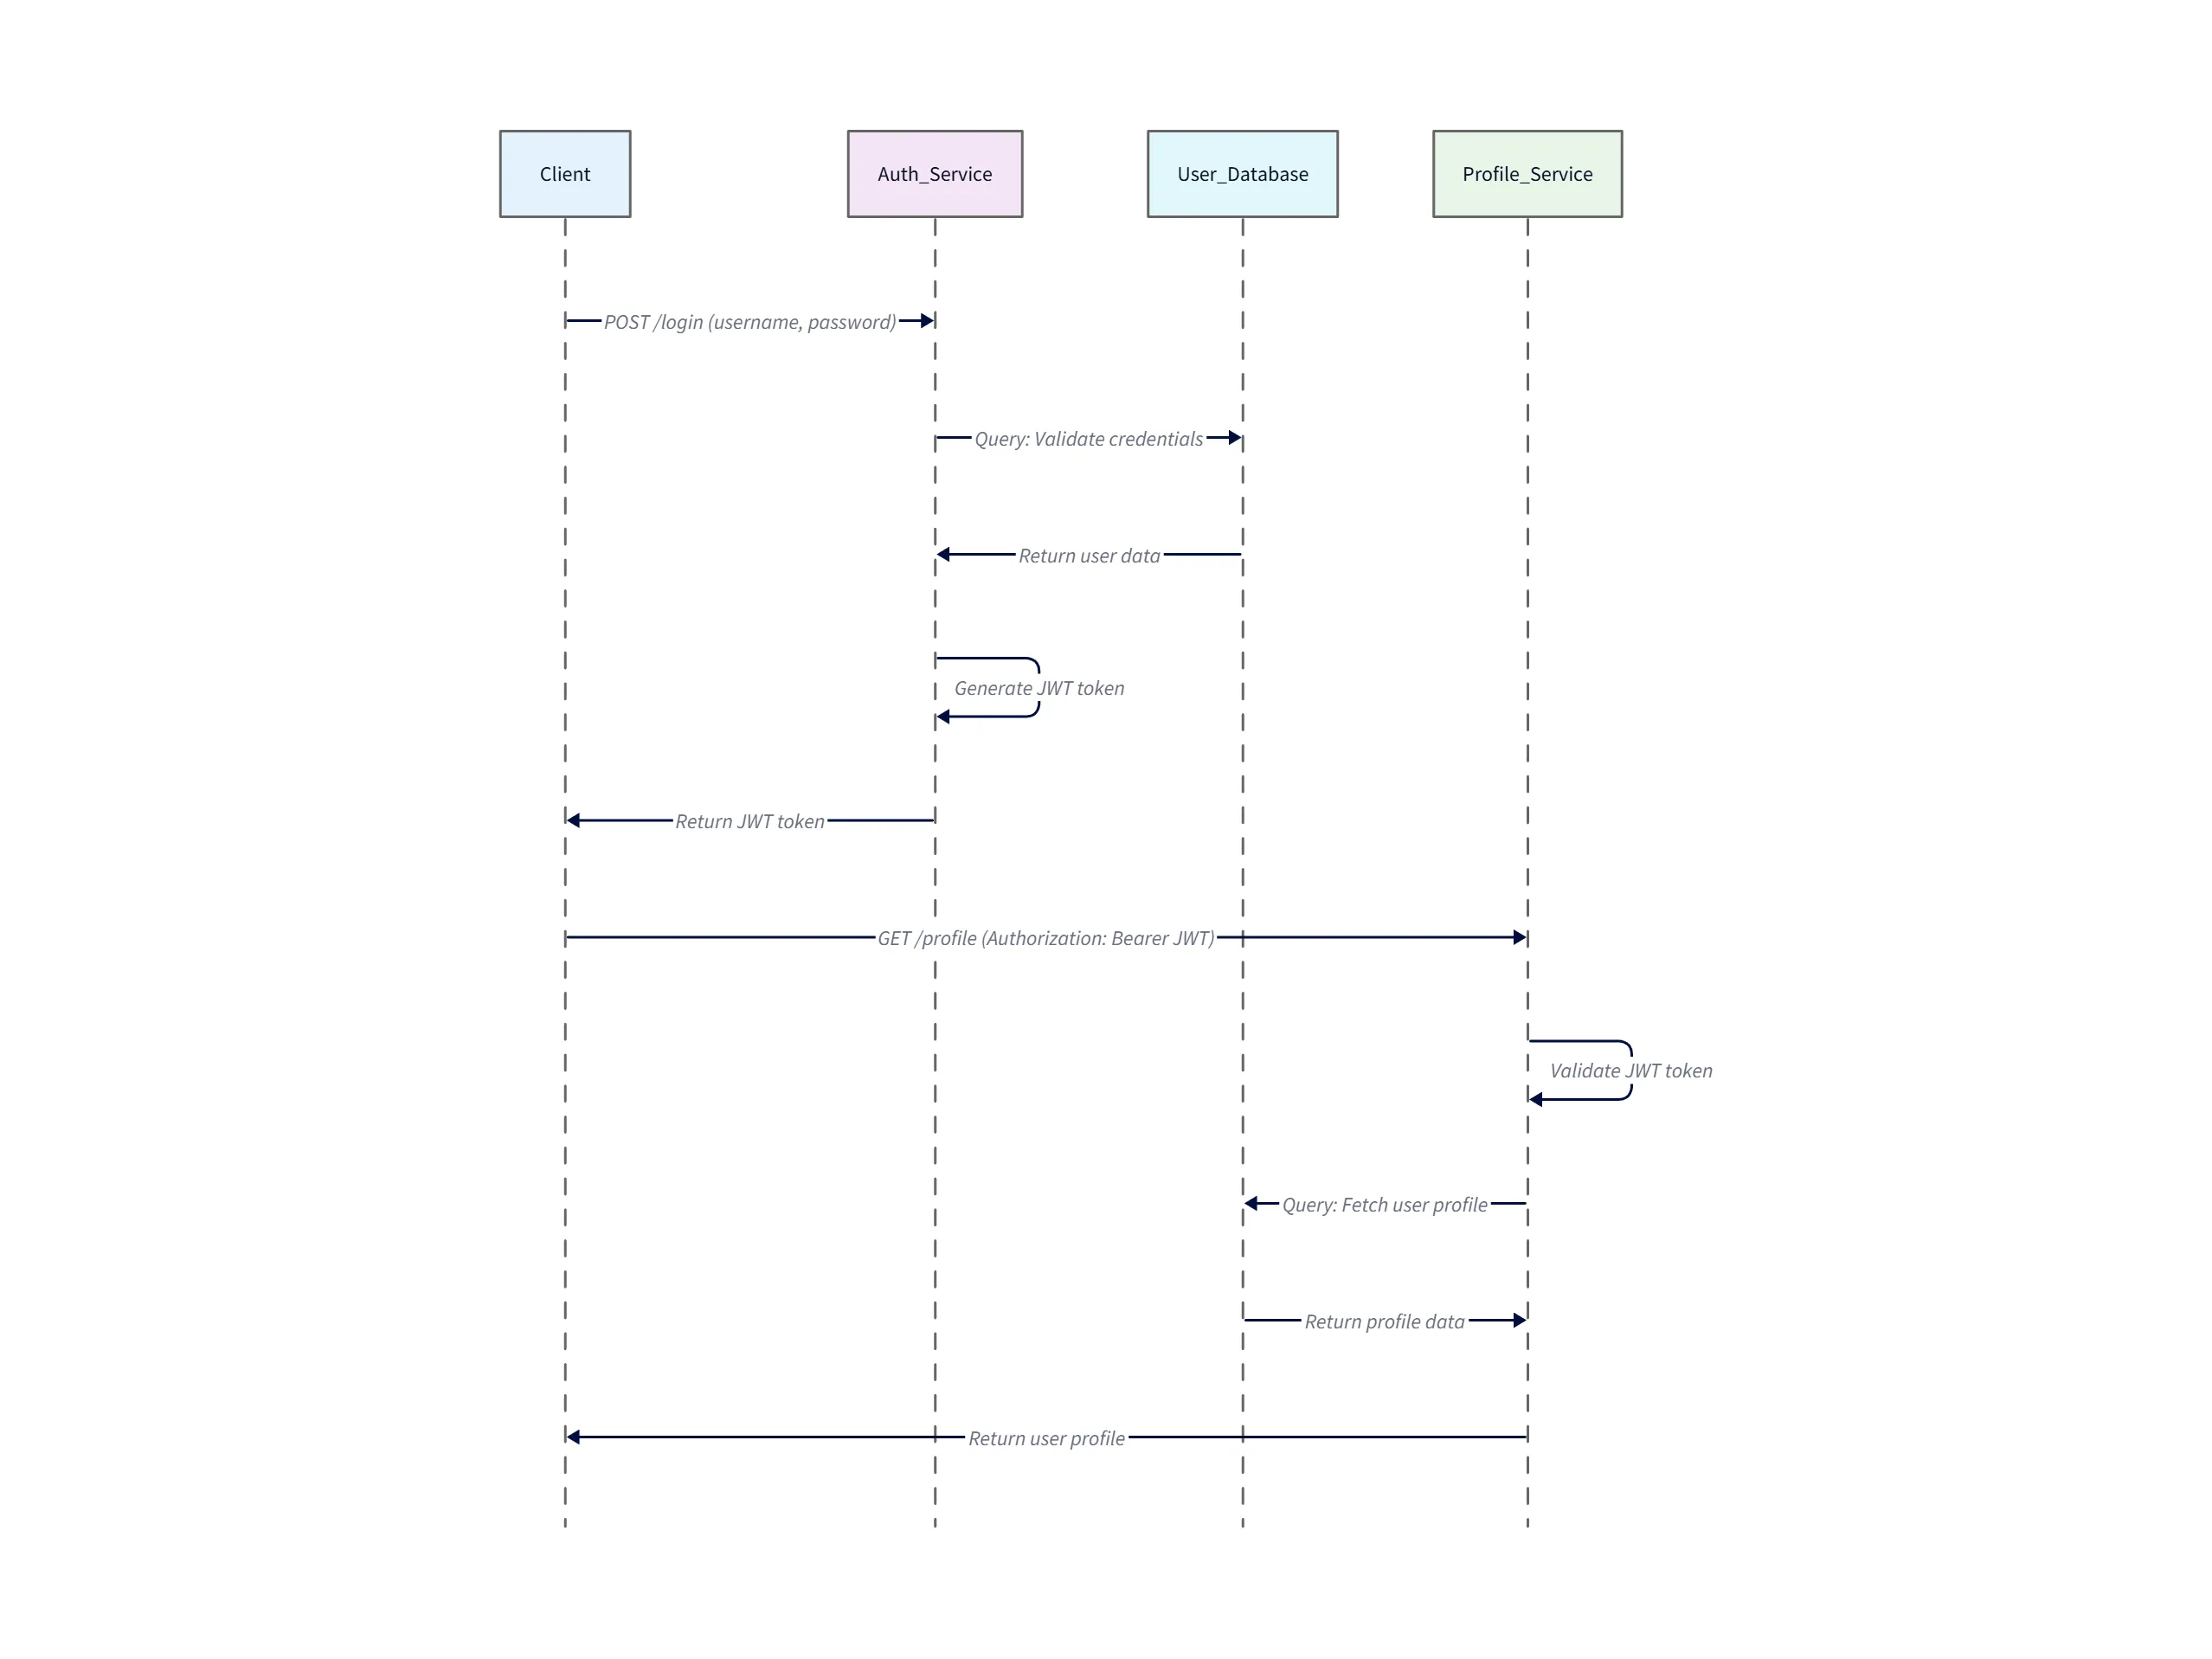
Follow-up Prompt: “Now, add a second part to the flow. The Client makes a GET request to a ‘/profile’ endpoint on a Profile Service, including the JWT in the Authorization header. The Profile Service validates the token and returns the user’s profile data.”
The diagram will instantly update. It will add a new lifeline for the Profile Service and show the second sequence of events happening after the first. Your diagram now tells a much more complete story of the entire authentication and authorization process.
Second-part explanation
- Client → Profile Service (GET /profile): The client sends a request for profile data and includes the previously issued JWT in the
Authorization: Bearer <token>header. - Profile Service (validate token): The Profile Service validates the JWT locally (verifies signature and claims) or calls an Auth/Introspection endpoint if using opaque tokens.
- Profile Service → User Database (fetch): After successful validation, the Profile Service queries the User Database for the user’s profile information.
- User Database → Profile Service (profile data): The database returns the profile data which the Profile Service formats as needed.
- Profile Service → Client (profile): The Profile Service returns the profile payload to the client; the client can now render the user’s account details.
This expanded view is useful for documenting where to place authorization checks, caching (e.g., profile cache), and monitoring (token validation failures, latency on DB lookups).
Conclusion: Make Your APIs Understood at a Glance
The benefits of this are, I think, pretty obvious. It leads to faster debugging, because you can visually trace the flow of data. It creates much clearer documentation for your team and for any external developers who might be consuming your API. And it makes onboarding new developers a whole lot easier when they can see how the services talk to each other instead of just reading code.
An AI diagram generator is becoming an essential tool for any team that builds or uses APIs. Read more: Ultimate Guide to AI Diagram Generation. It helps you stop just explaining your API flows and start actually showing them.
Generate your first API diagram with AIDiagramMaker.