· Workflow · 4 min read
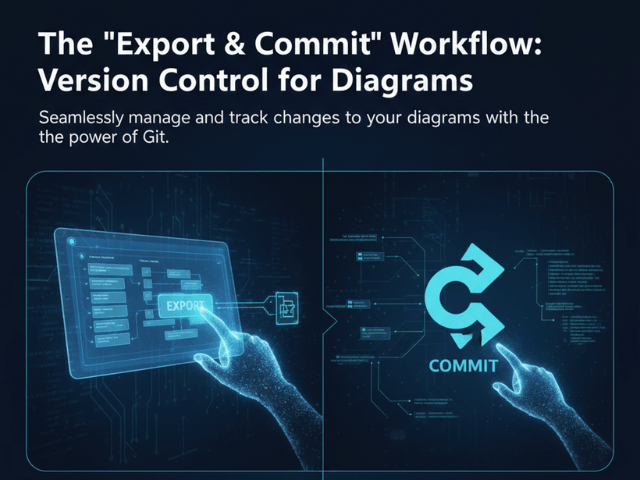
The 'Export & Commit' Workflow: Version Control for Diagrams
Stop treating diagrams like temporary email attachments. Learn the "export and commit" workflow to manage your D2 diagram definitions and SVG exports in Git, ensuring your visual documentation is as version-controlled as your code.
We treat our code like a precious asset. We track every character change. We write detailed commit messages. We have rigorous code review processes.
But we treat our diagrams like email attachments.
We save them as architecture_v2_final_FINAL.png and email them to the team. Or we upload them to a wiki where they sit until they are obsolete.
This double standard hurts us. If the diagram is the blueprint of the code it should live with the code. It should be version controlled.
This guide explains how to use AI Diagram Maker to bring your visuals into your Git workflow. We will be honest: right now this is a manual process. But this manual step gives you unprecedented control over your programmable diagrams.
Why Diagrams Belong in Your Git Repository
Your repository should be the single source of truth for your project.
Single Source of Truth
If a new developer clones the repo they should have everything they need to understand the system. They shouldn’t have to ask for a login to a third-party diagramming tool. They shouldn’t have to hunt through Google Drive.
By storing diagrams in Git you ensure that the documentation travels with the code.
Tracking Architectural Changes Over Time
Git gives you a time machine. You can go back to a commit from two years ago and see exactly what the code looked like.
If your diagrams are versioned text files you can do the same for your architecture. You can run git diff on a diagram definition file. You can see that in commit a4f9b2 someone added a Load Balancer.
This historical context is invaluable for debugging and understanding why decisions were made.
The Current Reality: Manual but Powerful Control
We are working on automating this but today the workflow requires you to be hands-on. And honestly many developers prefer it this way.
Why We Don’t Auto-Push (Yet)
We don’t automatically push to your repo because we don’t want to mess up your commit history.
We want you to verify the diagram first. We want you to decide where the file lives. We want you to write the commit message.
The Value of Inspecting D2 Code Before Committing
When you generate a diagram with our tool you get the image but you also get the source code usually in D2 format.
This code is readable. You can look at it. You can see the logic.
By manually handling this file you have a chance to inspect it. You can tweak a label. You can fix a typo. You act as the Quality Assurance gatekeeper for your documentation.
Step-by-Step Workflow
Here is the exact process for version controlling your visuals.
Step 1: Generate Diagram from Code/Prompt
Use AI Diagram Maker to create your visual. Paste your Python code or your SQL schema. Refine it with the chat until it looks perfect.
Step 2: Copy the D2 Definition
Look for the toggle to switch to Code View. You will see the underlying D2 syntax that defines your diagram.
Click the Copy button to grab this code. This text is your “source.”
You should also export the SVG image file using the standard export button. This image is your “build artifact.”
Step 3: Move File to Your Project Directory
Move these files into your project folder. We recommend creating a docs/diagrams folder.
Rename them to something meaningful like auth_flow.d2 and auth_flow.svg.
Step 4: git add and git commit
Open your terminal.
git add docs/diagrams/auth_flow.d2 git add docs/diagrams/auth_flow.svg git commit -m “docs: add authentication flow diagram”
That is it. You have version controlled your diagram.
Structuring Your Repo for Visuals
To keep things clean we suggest a standard structure.
Where to Store Diagram Assets
Keep your “source” files (.d2) separate from your “output” files (.svg or .png).
Some teams put the source in a src folder and the images in an assets folder. Find a convention that works for you and stick to it.
Linking SVGs in your README.md
Now you can embed the diagram in your Readme.
Because you are using a relative path this link works perfectly on GitHub GitLab or Bitbucket. When a user looks at your repo homepage they see the beautiful diagram rendered right there.
The Future: Roadmap for Automated Sync
We know that copying and pasting files feels a bit 2010.
What is coming next for GitHub integration
We are actively building a seamless native integration.
In the future you will be able to enable a “Sync to GitHub” setting. Once enabled all diagrams you create or update will be automatically committed to your connected repository in the background.
This will remove the manual step entirely ensuring your repo is always up to date with your visual documentation. But until then understanding the underlying file structure via the manual workflow is essential.