· Technical Guide · 6 min read
Visualizing Python Code: From Class Definitions to Diagrams
Discover how to use an AI-powered Python class diagram generator to instantly turn your code into visual blueprints. Learn to visualize Django models, track inheritance, and refactor spaghetti code without heavy IDE plugins.

Python is famous for being readable. We love it because it almost reads like English. But as your project grows that readability can hit a wall.
You start with a simple script. Then you add a few classes. Then you add inheritance. Then you add mixins. Suddenly you have a file with five hundred lines of code and you can’t remember if User inherits from AbstractUser or BaseModel.
When you are deep in a complex Django project or a large Flask application text isn’t enough. You need to see the structure. You need a map.
This guide explores how to use an AI-powered python class diagram generator to instantly turn your code into a visual blueprint. We will look at why manual mapping fails and how automating this process helps you refactor and understand your codebase faster.
The Challenge of Reading Raw Python Class Structures
Python’s flexibility is a double-edged sword. Because you can do anything you often end up with complex relationships that are hard to track mentally.
Mental Overhead of Tracking Inheritance and Mixins
In a large object-oriented Python codebase inheritance trees can get deep. You might have a class that inherits from a parent which inherits from a grandparent which pulls in two different mixins for utility functions.
When you are looking at the child class you only see the methods defined right there. You don’t see the methods inherited from the parents. To find a bug you have to jump between four different files. This context switching breaks your concentration. You are trying to compile the inheritance tree in your head which is exhausting.
Spaghetti Imports and Circular Dependencies
Then there are the imports. from .models import User. from .utils import Logger.
When everything imports everything else you create a web of dependencies. This spaghetti code is the primary cause of technical debt. It makes the code hard to test and hard to change. If you change one file you might break three others without realizing it because the connection wasn’t obvious in the text.
Visualizing these dependencies is the first step to untangling them.
How AI Diagram Maker Parses Python
We built our tool to understand Python syntax specifically. We don’t just treat it like generic text. We look for the structural markers that define your application’s architecture.
Identifying the class Keyword and Attributes
Our engine scans your code for the class keyword. This tells us “Here is a node for the diagram.”
It then parses the __init__ method to find self.variable assignments. These become the Attributes of the class. It allows us to populate the class box with the actual data fields making the diagram useful for understanding the data model.
Mapping def Methods to UML Operations
We also scan for def keywords inside the class scope. These identify the Methods or behaviors.
We differentiate between public methods and “private” methods (those starting with _ or __). Depending on the complexity we can filter these to show you just the public API or the full internal logic.
Inferring Relationships from Type Hints
Modern Python uses type hinting which is a goldmine for visualization.
If you have a function def set_owner(self, user: User): we know there is a relationship between this class and the User class. We can draw an association line automatically. This turns static type hints into a dynamic visual graph of how your objects interact.
Step-by-Step Guide: Generating a Python UML Diagram
Here is how you can go from a confusing file to a clear diagram in under a minute.
Connecting Your Repository or Copying Code
You have two powerful options.
Option 1: The GitHub Integration (Recommended)
Navigate to the code icon in the bottom left corner. This opens the repository connection wizard.
- Public Repos: Simply paste your GitHub URL (e.g.,
https://github.com/owner/repository). - Private Repos: Click “Connect GitHub” to securely authorize access to your private projects.
Once connected the tool will list your files. Browse to your models.py file and select it. This is the cleanest way to work as it pulls the latest code directly from your source.
Option 2: Manual Copy-Paste
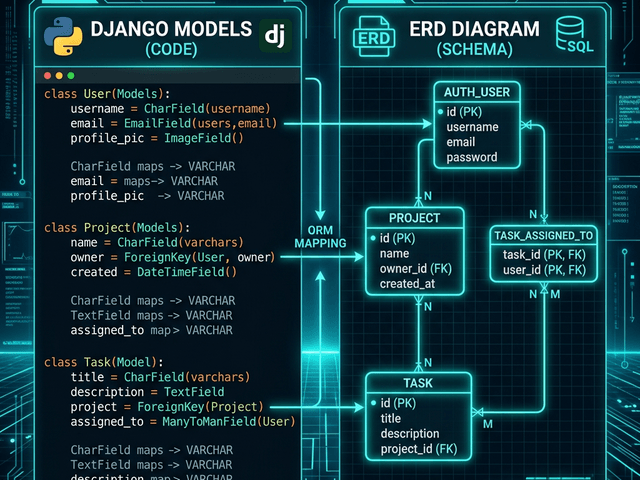
If your code isn’t on GitHub or you just want to visualize a local snippet you can do it manually. Open your models.py file in your IDE. Select the text. You don’t need to clean it up. Copy the class definitions for your Product, Category, and Order models and paste them directly into the input field.
Generating the Visual
Paste that code into AI Diagram Maker. Our AI recognizes the Python syntax. It ignores the Django-specific noise (like models.CharField) and focuses on the structure.
It generates a UML Class Diagram. You see boxes for Product, Category, and Order. You see lines connecting them.
Refining the Output via Chat
Maybe the diagram is too detailed. Maybe it shows every single helper method and you just want to see the data fields.
You can use the chat interface to refine it. “Hide methods. Only show attributes.”
Or maybe you want to highlight the core business logic. “Color the Order class red.” This allows you to create a diagram that tells a specific story about your code.
Scenario: Refactoring a Legacy Django Model
Imagine you inherit a legacy project. The previous developer put everything into one massive models.py file.
Visualizing the “Before” State
You paste that entire file into the tool. The resulting diagram is a giant spiderweb. It looks scary but it is honest. It shows you exactly how tangled the code is.
This technique is essential for visualizing a “Before State” prior to any major refactor.
Identifying Tight Coupling
You look at the diagram. You see that the UserProfile class is connected to twenty other classes. It is a “God Object.”
Seeing this visually confirms your suspicion. You realize you need to break it up. You can use the diagram to plan your refactor finding groups of related classes that can be moved into separate modules.
Why Text-Based Generation Beats IDE Plugins
You might ask “Why not just use a plugin in PyCharm or VS Code?”
No Heavy Installation Required
Plugins can be heavy. They index your whole project which can slow down your IDE. They often require configuration and dependencies (like Graphviz) that are a pain to install.
Our web-based tool requires zero setup. You copy. You paste. You get a result. It is lightweight and accessible from any machine.
Works with Snippets, Not Just Full Projects
Plugins usually try to visualize the entire project which creates a diagram so large it is unreadable.
With our text-based approach you curate the input. You only paste the three classes you are currently working on. This gives you a focused view that is actually useful for the task at hand. It creates a micro-map for your specific problem rather than a map of the entire world.
This text-based approach aligns with how developers actually work tackling one module at a time. It turns diagramming from a heavy documentation task into a quick daily utility.