· Software Development · 3 min read
Scenario: Visualizing a "Before State" for Refactoring
This scenario explores how to map dependencies and visualize legacy code before refactoring to safely manage technical debt using AI diagram tools.
You just joined a new team. Your manager assigns you your first big task. “We need to modernize the Billing Module. It is a bit messy.” “A bit messy” turns out to be the understatement of the year. You open the code. It is thousands of lines of legacy Java or Python. Classes are importing each other in circles. There is a Utility class that seems to be doing everything from calculating tax to sending emails. You need to refactor this. You need to extract the email logic into a microservice.
But you are afraid. You are afraid that if you move one line of code you will break a hidden dependency. You are afraid because you don’t have a mental model of how it works. Before you make a single cut you need a map.
The Situation: Inheriting a Messy Codebase
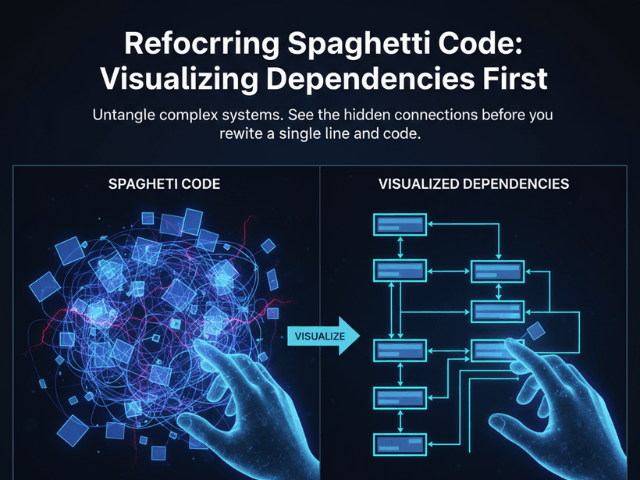
Legacy code is code that works but is hard to change. It is usually poorly documented. The original authors are gone. When you look at the file list you see the files but you don’t see the structure. Text editors show you lines of code. They don’t show you the web of relationships. Trying to refactor by just reading the code is like trying to untangle a ball of yarn in the dark. You pull one thread and the knot gets tighter.
The Goal: Map the Dependencies Before Changing Code
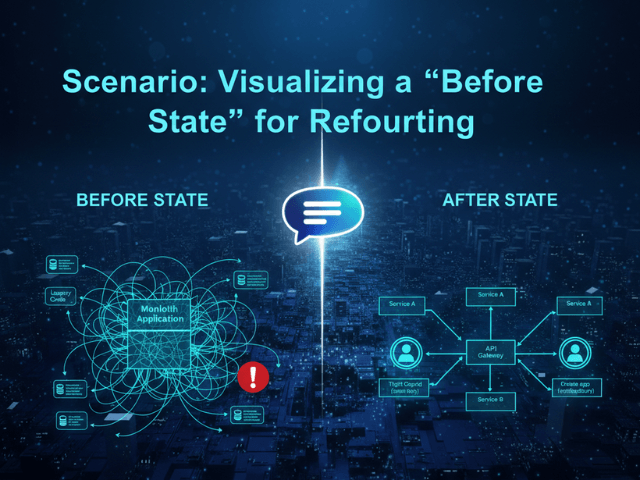
Your goal is to create a Class Diagram or a Dependency Graph. You want to see exactly which classes call the EmailSender. If you can visualize that you can identify the “seam” where you can safely cut the code. You want to see the “God Objects” that are coupled to everything.
The Workflow:
Here is how you use AI Diagram Maker to build that map safely.
Importing Files via GitHub
Don’t try to draw this by hand. It would take weeks and you would make mistakes. Instead navigate to the code icon in AI Diagram Maker. Connect your GitHub repository. Browse the file tree and select the specific files in the billing module. You don’t need to manually copy-paste text from your IDE. You simply select the files and the AI reads the raw source directly.
Generating the Diagram to Spot Coupling
Paste it into the tool. The AI parses the inheritance and the imports. It draws a box for every class. It draws a line for every dependency. Suddenly the mess becomes visible. You might see a spiderweb of lines pointing to BillingManager. You might see a strange cycle between Invoice and Customer. You spot the issue immediately. “Wait why does the TaxCalculator depend on the UserSession?” That dependency shouldn’t be there. That is a refactoring target.
The Result: A Clear Refactoring Plan
Now you aren’t guessing. You have a plan. Phase 1: Break the dependency between Tax and User. Phase 2: Extract the Email logic into an Interface. Phase 3: Move the implementation to a new service. You can even show the “Before” diagram to your manager to explain why the refactor will take two weeks. Visual proof of complexity is a powerful tool for managing expectations.
Start mapping your legacy code. Don’t code in the dark. Use AI Diagram Maker to visualize your spaghetti code before you touch it. It is the safest way to tackle technical debt.
The Programmable Diagram: A Developer’s Guide to D2 and Text-Based Visuals
For more on how to leverage text-based tools for your engineering workflow, read our guide: The Programmable Diagram: A Developer’s Guide to D2 and Text-Based Visuals.