· Developer Tools · 11 min read
The Programmable Diagram: A Developer’s Guide to D2 and Text-Based Visuals
This guide explores text-based diagramming tools and the shift toward programmable visuals. Learn how AI Diagram Maker leverages the D2 language to turn your code and logic into diagrams automatically, giving you the control of a developer with the output of a designer.
I want you to think about the last time you had to update a system architecture diagram. You probably opened a browser tab and waited for a heavy web app to load. You found the box representing the “Auth Service.” You needed to move it to the right to make room for a new “MFA Provider” box.
You dragged it. But then the arrow connecting it to the database got weird and crooked. You spent five minutes trying to make the line straight again. Then you realized the font size was inconsistent with the rest of the chart.
By the time you fixed the alignment you had forgotten why you opened the diagram in the first place.
This is the reality of visual documentation for most developers. We build sophisticated automated systems using code but we document them using manual drag-and-drop tools that feel like finger painting. It is inefficient. It is frustrating. And frankly it is the reason most documentation is outdated the moment it is saved.
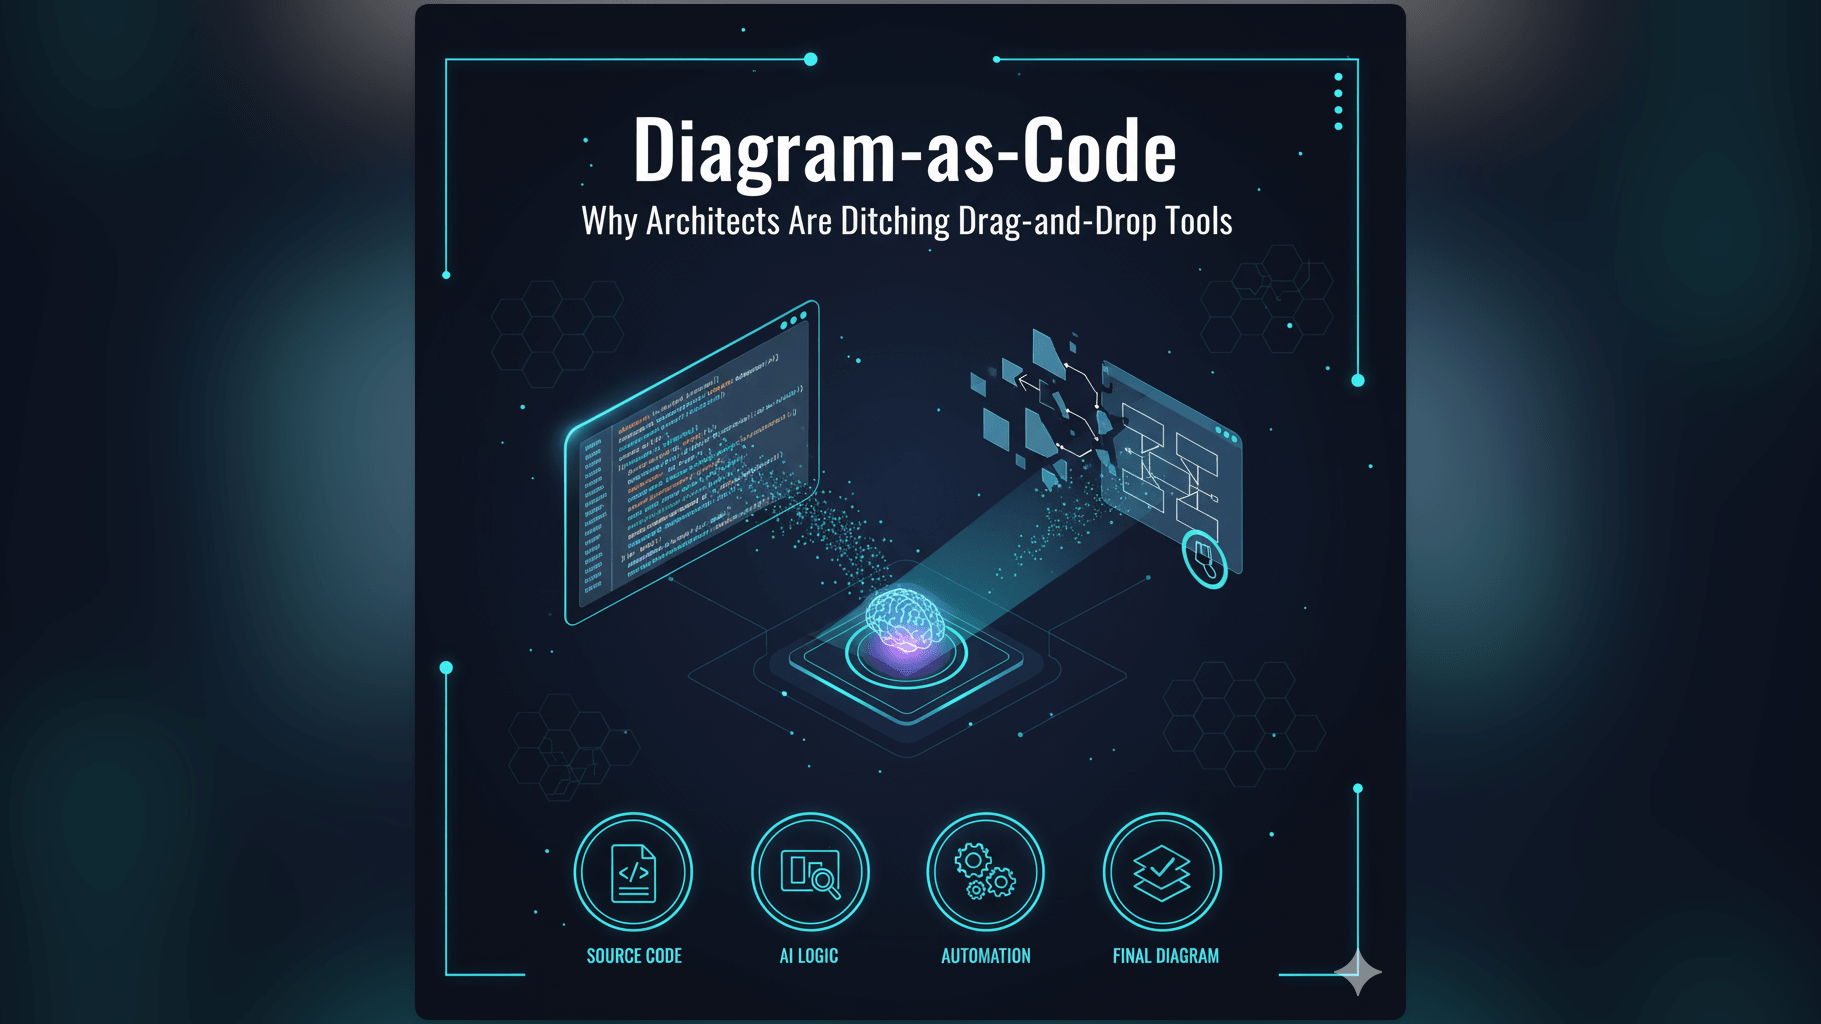
This guide explores a different approach. We are looking at text based diagramming tools and the shift toward programmable visuals. We will explore how AI Diagram Maker leverages the D2 language to turn your code and logic into diagrams automatically giving you the control of a developer with the output of a designer.
TL;DR: Dragging boxes is a waste of engineering time. Text-based diagramming allows you to define visuals using code or natural language which solves the problem of version control and layout maintenance. AI Diagram Maker acts as a bridge converting your Python, Java, SQL, or JSON directly into D2 code. This generates professional diagrams instantly. While we are building automated Git syncing features right now you can manually export this D2 code to your repo ensuring your visuals live alongside your source code.
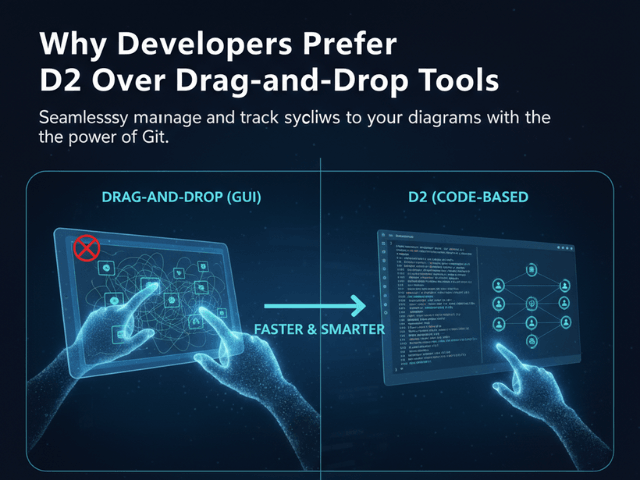
The Problem with Pixels: Why Drag-and-Drop Fails Engineers
Engineers deal in logic and structure. Traditional design tools deal in pixels and position. This mismatch creates a huge amount of friction.
The “Binary Blob” Problem (Why you can’t diff a PNG)
The biggest issue with tools like Visio or basic image exports is that they produce “binary blobs.”
When you save a PNG or a JPEG to your repository it is just a chunk of unreadable data. If a colleague updates the architecture diagram you see a notification that architecture.png changed. But you cannot see what changed.
Did they add a server? Did they change a dependency? Did they just move a box three pixels to the left?
You cannot run git diff on an image. This breaks the code review process. You have to open both images side by side and play a game of spot the difference. In a high-velocity team this lack of transparency is dangerous. It means architectural changes can slip through unnoticed.
Context Switching: Leaving the IDE to Draw Boxes
Developers live in the IDE. We enter a flow state where we hold complex logic structures in our minds.
Forcing a developer to leave VS Code or IntelliJ to open a separate design tool breaks that flow. It is a context switch. You shift from “Coding Mode” (logical, structural) to “Drafting Mode” (spatial, aesthetic).
The cognitive load required to translate code structure into a visual layout manually is high. You have to read the code understand the relationships and then recreate them shape by shape. Because this is hard we tend to procrastinate doing it.
The Inconsistency of Manual Styling
If you ask five developers to draw a flowchart you will get five different styles.
One will use blue rectangles with rounded corners. Another will use black squares. One will use solid arrows while another uses dashed lines.
This inconsistency makes documentation hard to read. It looks unprofessional. To fix it someone usually the Tech Lead has to go in and manually reformat everyone’s work to match a style guide. That is not a good use of a Tech Lead’s time.
What Is a Programmable Diagram?
A programmable diagram flips the script. Instead of drawing the image you write the definition of the image.
Defining “Diagram-as-Code” (DaC)
Diagram-as-Code or DaC is the philosophy that diagrams should be defined by text.
You write a script that says “Service A talks to Service B.” A rendering engine reads that script and draws the box for Service A the box for Service B and the arrow connecting them.
This brings all the benefits of software engineering to documentation. You can version control the text file. You can diff the changes. You can copy and paste logic. You can generate it programmatically.
The Role of D2 (Declarative Diagramming) Language
There are several languages for this but we rely heavily on D2.
D2 stands for Declarative Diagramming. It is a modern language designed to turn text into diagrams. Unlike older tools that require you to specify coordinates or complex syntax D2 is readable.
You might write: User -> API: Login Request
D2 takes that simple line and handles all the routing and geometry. It figures out where to put the User and the API so the arrow doesn’t cross over other lines messy. It handles the “how” so you can focus on the “what.”
Diagram
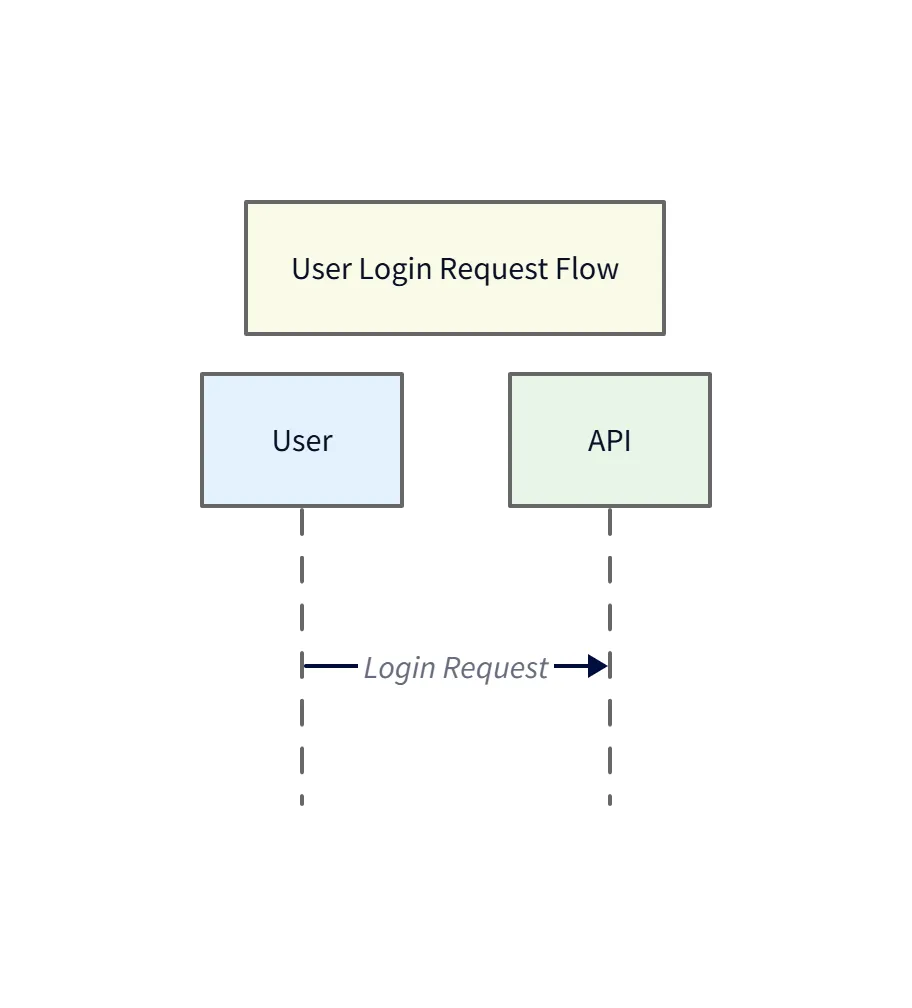
Diagram Explanation
- Actors:
User(client) andAPI(server) are shown as lifelines. - Interaction: A single
Login Requestarrow represents the client initiating authentication with the API. - Use: This minimal sequence diagram demonstrates how a simple D2 line maps to a readable visual; expand it with additional calls (e.g.,
API -> AuthService) to show authentication steps.
How AI Bridges the Gap Between Natural Language and D2 Syntax
While D2 is great you still have to learn the syntax. You have to remember if you need a semicolon or a bracket.
AI Diagram Maker acts as the translation layer. You don’t need to know D2. You can just speak English or paste your Python code.
Our AI analyzes your input understands the relationships and writes the D2 code for you. It effectively makes the diagramming process “No-Code” for you while keeping the output “Code-Based” for your repository.
The “Text-to-Visual” Stack: How AI Diagram Maker Works
It helps to understand what is happening under the hood. We aren’t just matching keywords to clip art. We are running a sophisticated processing pipeline.
Input Layer: Python, Java, SQL, or English
The process starts with your input. We accept natural language descriptions if you are brainstorming. But we also accept structured code.
You can paste a CREATE TABLE statement from your SQL database. You can paste a Python class definition. You can paste a raw JSON payload. We treat these inputs as the “Source of Truth.”
Processing Layer: AI Logic Extraction
Once we have the input our AI engine parses it for structure.
If you provided SQL it looks for foreign keys to understand relationships. If you provided Python it looks for inheritance patterns.
It extracts the entities (nodes) and the connections (edges). It abstracts away the noise. For example if you paste a 500-line Java file we ignore the import statements and the comments and focus on the method calls that define the sequence.
Rendering Layer: The D2 Engine
The AI constructs a D2 script based on that extracted logic. It then passes that script to the D2 rendering engine.
This is where the visual magic happens. The engine calculates the optimal layout. It routes the connections. It applies a consistent styling theme. It outputs a vector graphic usually an SVG or a PNG that represents your logic perfectly.
Supported Stacks: Integrating Visuals into Your Codebase
We have optimized our AI models to handle specific technical stacks. This allows you to generate highly specific diagrams depending on what language you are working in.
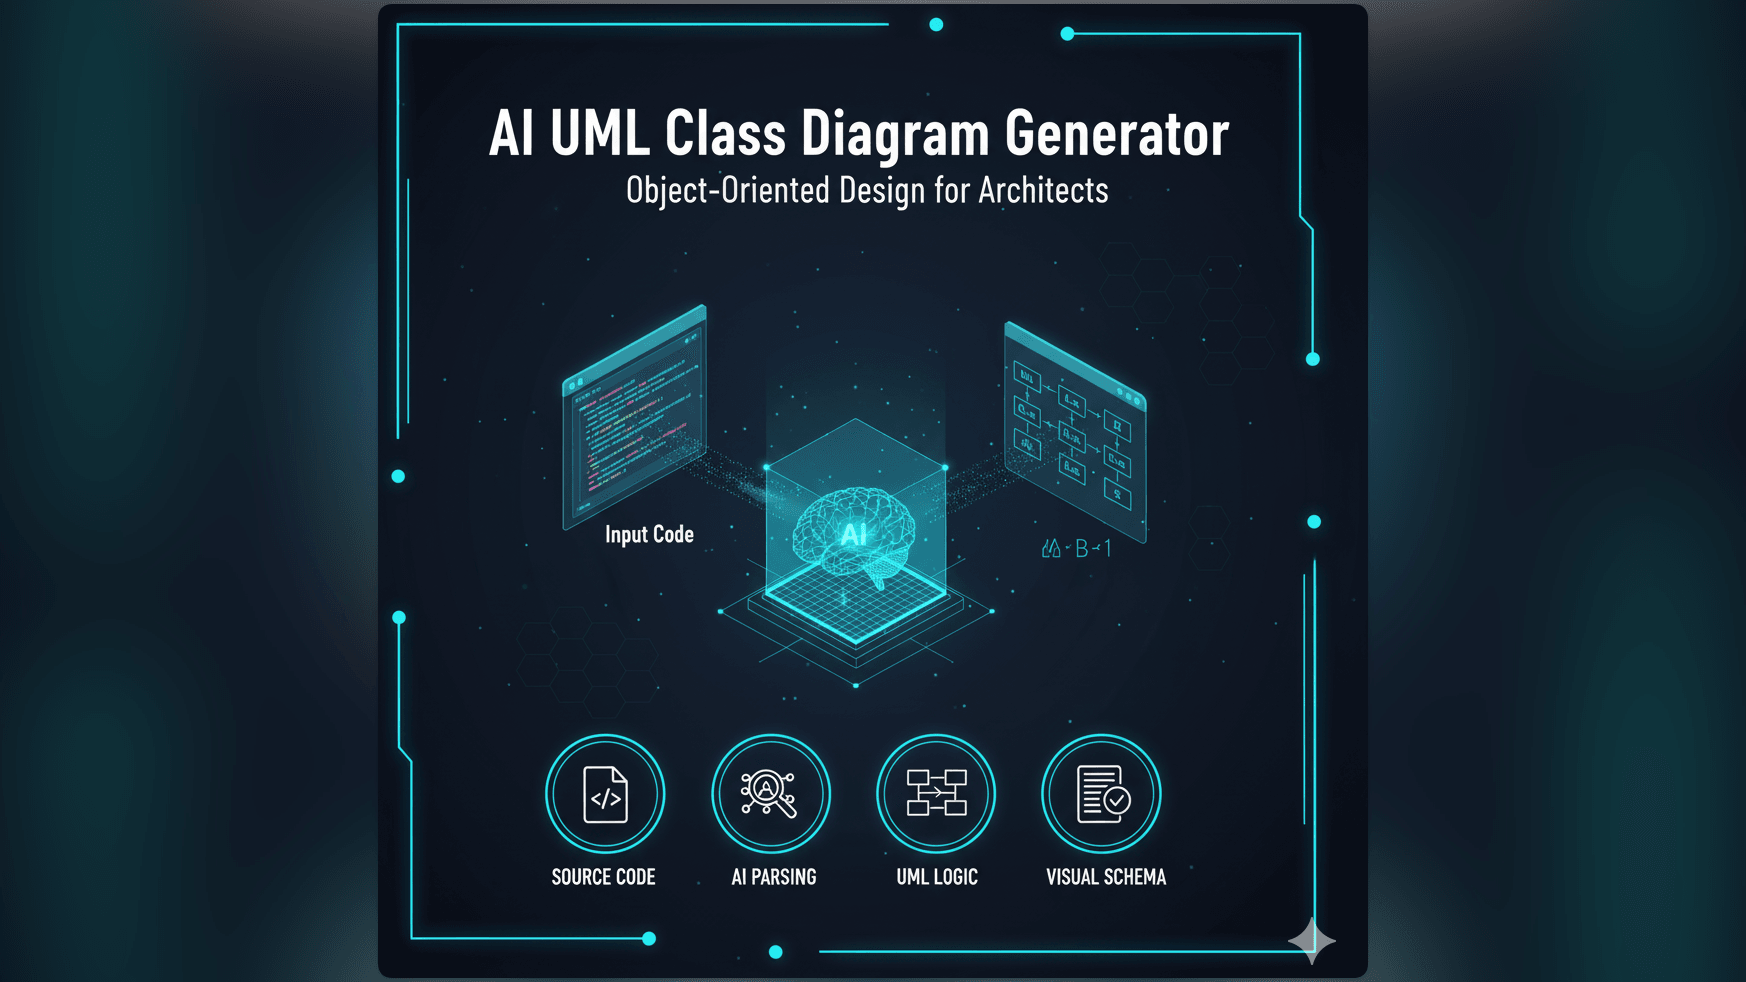
Python: From class definitions to UML structures
For Python developers we focus on Class Diagrams.
You can paste your Django models or your basic Python classes. We interpret the class definitions and the member variables. We identify relationships like inheritance and composition.
The output is a UML Class Diagram that shows exactly how your objects relate. This is incredibly useful for refactoring legacy Python code where the inheritance chain has gotten messy.
Java: Tracing method calls for Sequence Diagrams
Java is often used in complex enterprise systems where understanding the flow of execution is critical.
We focus on generating Sequence Diagrams from Java code. You can paste a method that contains complex business logic. We trace the calls to other services or repositories.
We visualize the synchronous calls and the return types. This turns a dense stack trace into a clear timeline of events helping you debug logic errors or concurrency issues.
SQL (Postgres): Mapping schemas via Primary/Foreign Keys
Database schemas are notoriously hard to visualize from text.
We support PostgreSQL and other SQL dialects. By pasting your schema dump we map the tables. We use the Primary Key and Foreign Key constraints to draw the crow’s foot notation lines between tables.
This allows you to see the topology of your data. You can instantly spot isolated tables or circular dependencies that might cause issues down the line.
JSON: Visualizing Data Models as Class Diagrams
JSON is the language of the web but reading large JSON files is painful. You lose track of the nesting.
We allow you to visualize JSON structures as Class Diagrams.
We map JSON objects to Classes. We map the keys to Attributes. We map nested arrays to Relationships showing the cardinality (one-to-many). Note that since JSON is data-only these diagrams won’t show methods but they provide a perfect visual map of your API payloads or NoSQL document structures.
The Developer’s Workflow: Control and Precision
We designed our workflow to give you control. We know that AI isn’t perfect 100% of the time so we built a process that allows you to inspect and refine.
Step 1: Input Logic (Code/Text)
You start by pasting your code or typing your requirements into AI Diagram Maker. This is the only creative step.
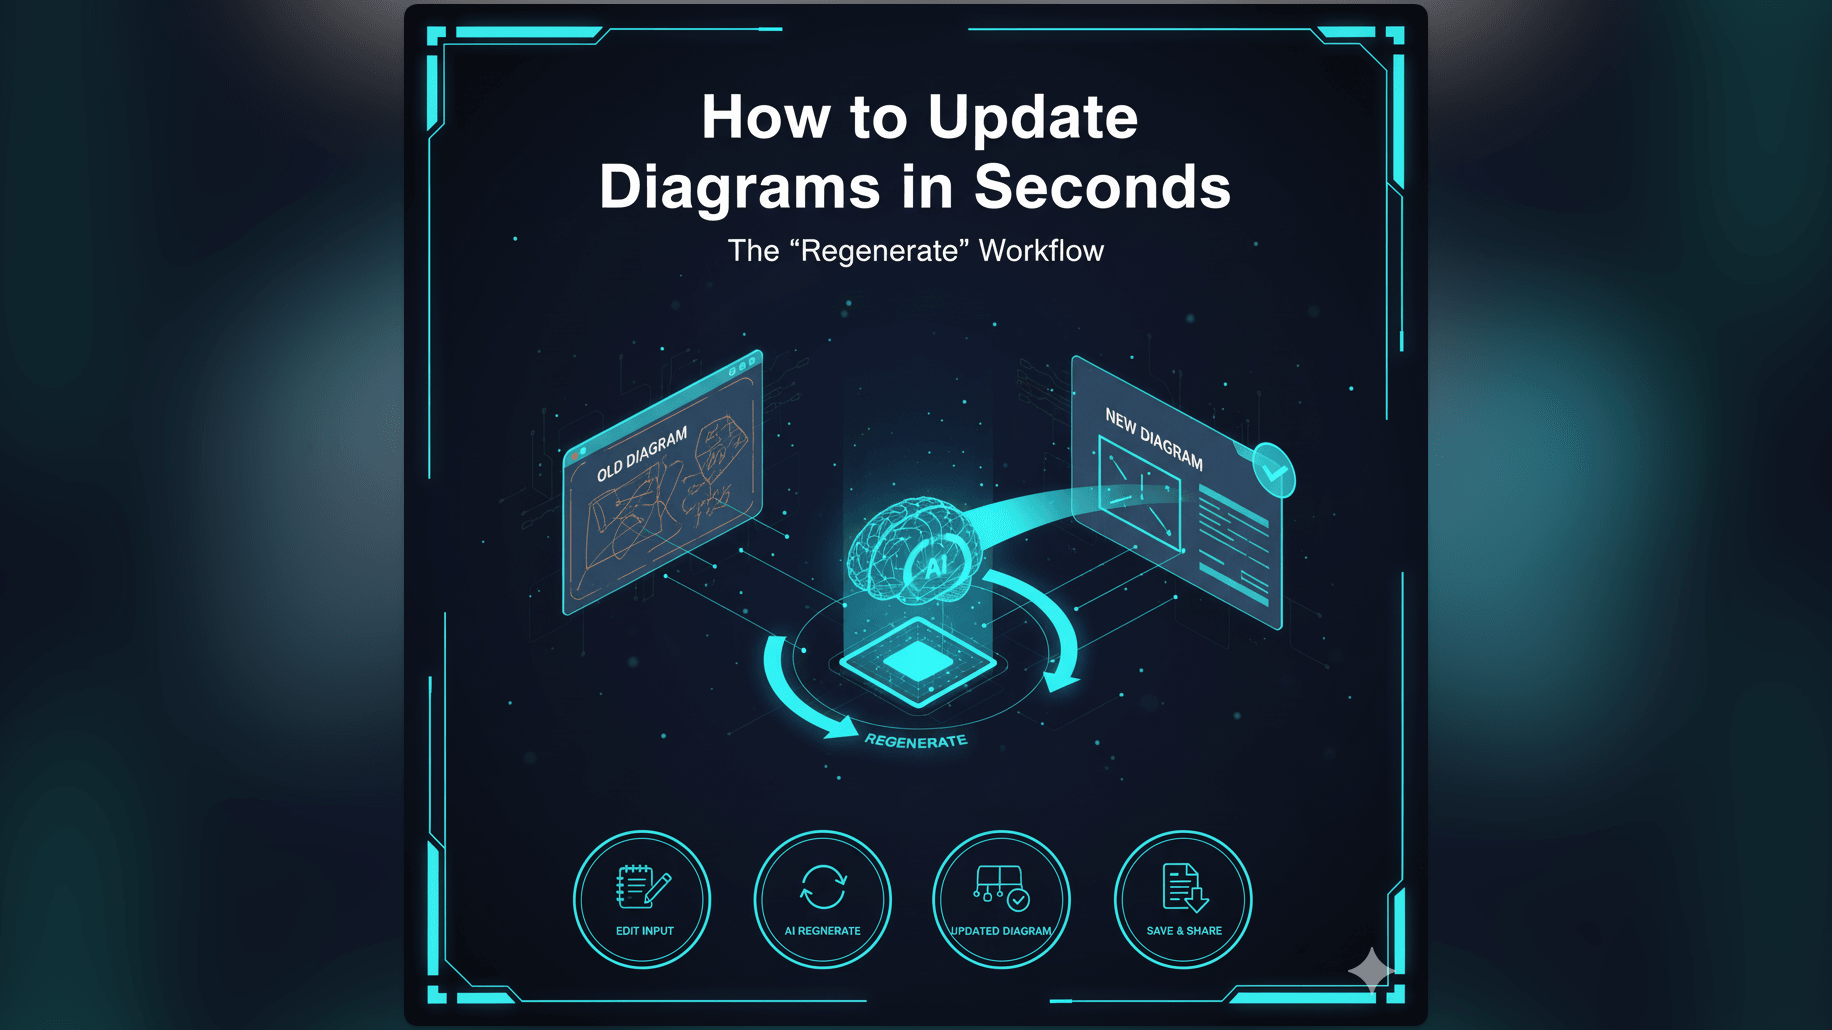
Step 2: AI Generation
The AI builds the initial diagram. This usually takes a few seconds. You see the result on the canvas.
You can use the chat interface to refine it. “Make the database box red” or “Group the API services together.” This updates the underlying definition.
Step 3: Manual Export (The “Control” Feature)
Once the diagram is right you export it.
We provide the option to export the D2 code. This is a text file. You can open it in a text editor and read it. You can tweak it manually if you want granular control over a specific connection label.
Step 4: Committing to Version Control
You take that D2 file (and the generated SVG) and move it into your project repository. You run git add. You run git commit.
Now your diagram is versioned. It is part of the project history. If you need to rollback the code you can rollback the diagram too.
Why “Manual Export” is currently a Feature, Not a Bug
You might ask “Why doesn’t it just sync to GitHub automatically?”
While we are building that feature we believe the manual workflow offers a level of safety and control that is valuable.
Inspecting the Output Before Committing AI is powerful but it is probabilistic. It can make mistakes. By forcing a manual export step we ensure that a human reviews the diagram before it enters the codebase. You are the gatekeeper. You ensure that the documentation is accurate.
Keeping Your Repo Clean Automatic tools can sometimes spam your repository with unnecessary commits or temp files. By manually exporting you decide exactly where the file goes and how it is named. You maintain the hygiene of your project structure.
Future Roadmap: Automated GitHub Syncing
That said we know automation is the goal. We are actively working on a native GitHub integration that will allow you to sync changes with a single click. But even then we will likely implement a “Review” step to maintain that layer of control.
Use Cases for Programmable Diagrams
Where does this fit into your day-to-day work?
System Architecture Documentation (High-Level)
Use it to create the “Big Picture” view. Define your abstract nodes like “Load Balancer” and “Web Server” and let the tool layout the topology. This is perfect for onboarding docs.
Database Schema Visualization
Use it before running a migration. Visualize the v1 schema and the v2 schema to ensure you haven’t missed any critical data relationships.
API Flow Documentation
Use it to document your endpoints. Visualize the request and response cycle including error states. This is valuable for frontend teams who need to understand how to consume your backend APIs.
Frequently Asked Questions about Text-Based Diagramming
Do I need to learn D2 syntax to use this tool?
No. That is the beauty of it. AI Diagram Maker handles the D2 generation. You just provide the natural language or the code. However knowing D2 can be useful if you want to manually fine-tune the exported file later.
Can I edit the generated D2 code manually?
Yes. When you export the D2 file it is just text. You can edit it in any text editor or IDE. This gives you ultimate flexibility.
How does this compare to Mermaid.js?
Mermaid.js is a fantastic tool and we respect it. However D2 offers a more powerful layout engine. It generally produces diagrams that look less “tangled” especially for complex architectures. Our AI is optimized to generate D2 because it handles the spatial logic better allowing for more professional-looking results without manual intervention.