· Glossary · 3 min read
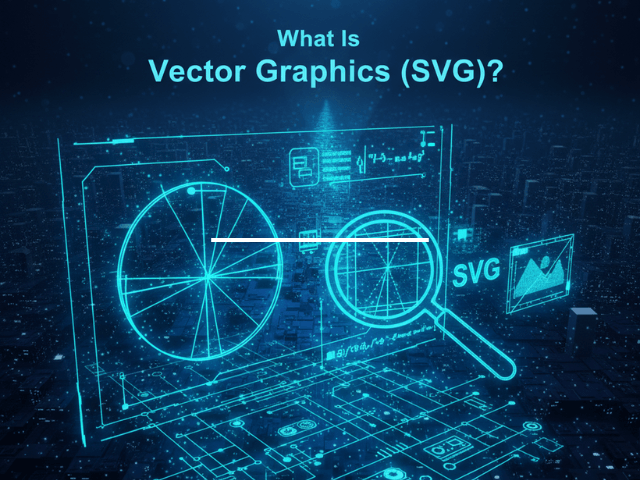
What Is Vector Graphics (SVG)?
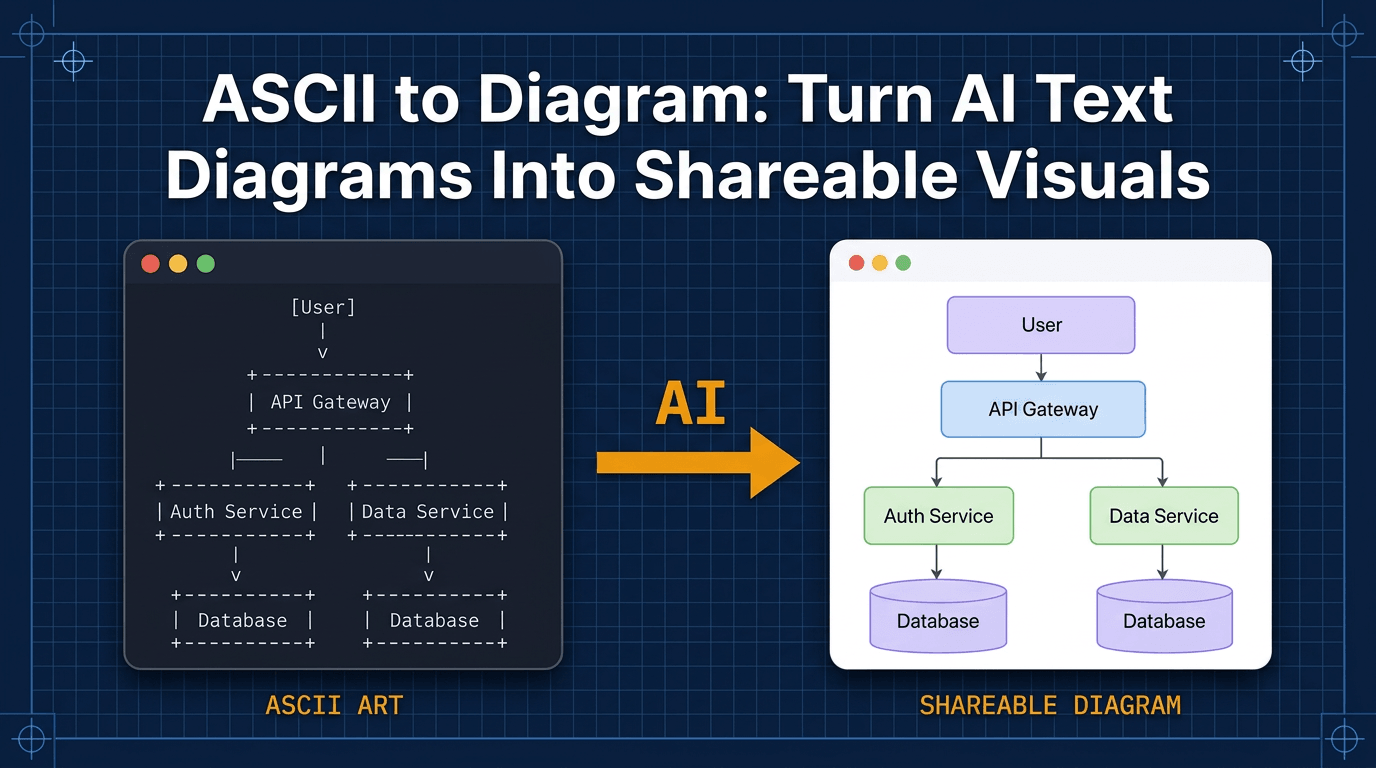
SVG (Scalable Vector Graphics) is an XML-based text format that describes two-dimensional images using mathematical instructions, allowing for infinite scaling without loss of quality, making it ideal for diagrams and technical documentation.
We all know JPG and PNG files. They are photos. If you zoom in, they get blurry and blocky. SVG is different. It is an image that never gets blurry no matter how much you zoom.
Simple Definition
SVG stands for Scalable Vector Graphics. It is an XML-based text format for describing two-dimensional images. Unlike a photo, which is a grid of colored pixels, an SVG is a set of math instructions. A JPG says “Pixel 1 is blue. Pixel 2 is red.” An SVG says “Draw a circle at coordinate 50,50 with a radius of 10 and fill it with blue.” Because it is math, the browser can redraw it at any size perfectly.
Images Defined by Math, Not Pixels
This makes SVG unique. It is actually code. You can open an .svg file in a text editor like VS Code and read it. You will see tags like <circle> and <rect>. You can even change the colors by typing a new hex code.
SVG vs Raster (PNG/JPG)
The difference is fundamental to digital documentation.
- Raster (PNG, JPG, GIF): Good for photos. Bad for diagrams. File size grows huge if you want high quality.
- Vector (SVG): Good for diagrams, logos, and icons. File size stays tiny even if the image is massive.
Why It Matters for Docs
For software engineers, SVG is the holy grail of documentation formats.
Infinite Scalability and Code-Based Editing
- Resolution: You can print a system architecture diagram on a billboard or view it on a Retina iPhone. It will always be razor sharp. This is critical for reading tiny text in complex diagrams.
- Searchable: Because the text inside an SVG is real text (not pixels of text), you can Ctrl+F to find a specific server name inside the diagram.
- Git Friendly: Because it is text, you can technically track changes to it in version control, although it is verbose. This is why AI Diagram Maker prioritizes SVG exports. It ensures your technical documentation looks professional everywhere.
Related Terms
To understand graphics formats, you should know these terms.
- Raster: Images made of pixels. The opposite of Vector.
- D2: A declarative language that compiles into SVG. Read more about D2 in our Developer’s Guide: The Programmable Diagram: A Developer’s Guide to D2 and Text-Based Visuals.
- Rendering: The process of calculating the pixels from the vector instructions.
- XML (Extensible Markup Language): The text format used to write SVG files.
For more on choosing the right format for your docs, check out our guide on SVG vs. PNG: Why Vector Graphics Matter for Technical Docs.