· Documentation · 4 min read
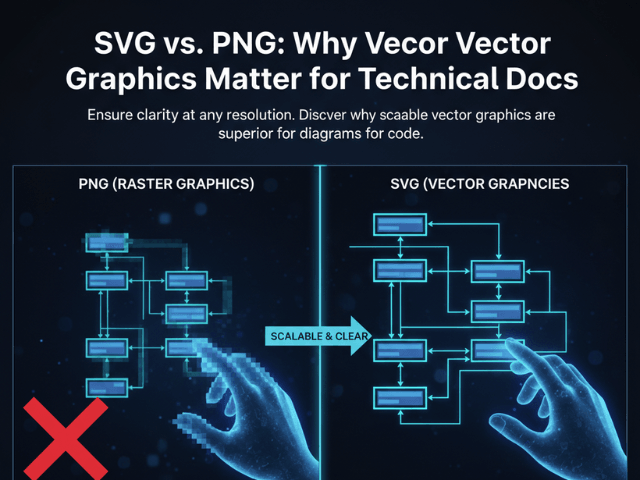
SVG vs. PNG: Why Vector Graphics Matter for Technical Docs
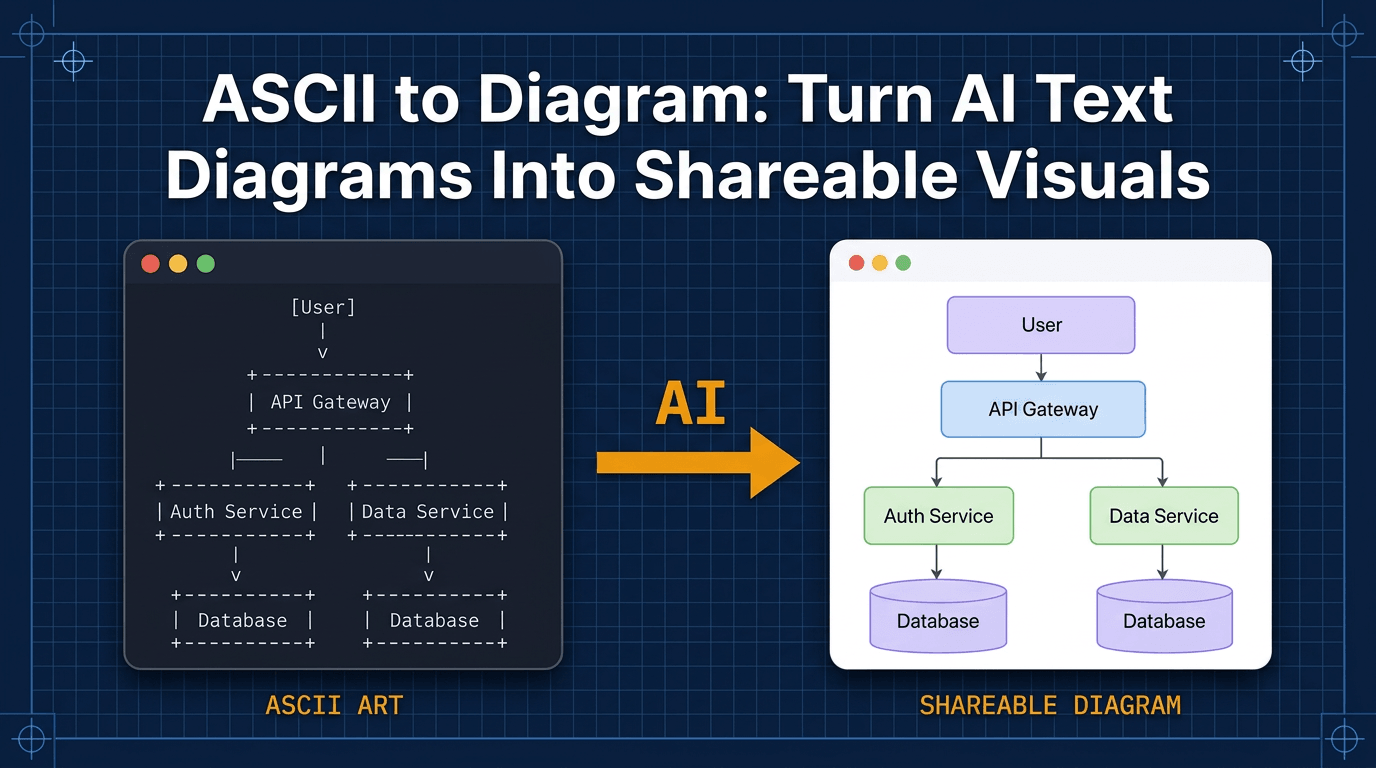
This guide explains why SVG (Scalable Vector Graphics) is the only professional choice for engineering documentation and how an SVG diagram generator like AI Diagram Maker solves the resolution problem forever.
We spend hours perfecting our diagrams. We align the boxes. We check the logic. We verify the architecture. And then we ruin it all at the last second. We click “Export to PNG.”
We take that low-resolution raster image and paste it into our documentation. It looks okay on our laptop screen. But then a user views it on a 4K monitor. Or someone tries to print it for a design review. Or they try to zoom in to read the database schema details. It becomes a blurry, pixelated mess. The text is unreadable. The lines are jagged.
This guide explains why SVG (Scalable Vector Graphics) is the only professional choice for engineering documentation and how an SVG diagram generator like AI Diagram Maker solves the resolution problem forever.
The Problem with Raster Images (PNG/JPG)
Formats like PNG and JPG are “Raster” images. They are made of a grid of colored pixels.
Pixelation on Zoom
When you zoom in on a PNG, the computer just makes the pixels bigger. It does not know that the blurry gray square is supposed to be the letter “A”. It just sees a gray square. Technical diagrams are often dense. An ERD might have tiny text labeling the column types. If that text is pixelated, the diagram is useless.
Large File Sizes
To make a PNG crisp, you have to make it huge. You export it at 4000x4000 pixels. Now you have a 5MB file. This slows down your wiki page load time. It bloats your Git repository if you commit it. It is inefficient.
Inability to Search Text
This is the biggest drawback for developers. A PNG is a flat picture. You cannot Ctrl+F to find “UserTable” inside a PNG. Search engines cannot index the text inside it. Accessibility screen readers cannot read it to visually impaired developers.
The Power of Scalable Vector Graphics (SVG)
SVG is different. It is not a grid of pixels. It is code. An SVG file is actually an XML text file that says “Draw a circle at this coordinate with a radius of 50.”
Infinite Scaling (Retina Displays)
Because it is math, you can zoom in infinitely. You can blow it up to the size of a billboard, and the lines will remain razor sharp. This means your diagrams look perfect on a mobile phone screen and on a 5K Retina display. You never have to worry about resolution again.
Tiny File Sizes (Code-based)
Because it is just a set of instructions, SVGs are tiny. A complex architecture diagram that would be 2MB as a PNG might be 20KB as an SVG. It loads instantly. It is respectful of your users’ bandwidth.
Editability via Code
Because SVG is code, you can edit it. You can open an SVG file in a text editor and change the color of a line by changing a hex code. You can use CSS to style it. You can even animate it.
How AI Diagram Maker Utilizes SVG
We treat SVG as a first-class citizen.
Converting D2 logic to Vector Paths
When our engine generates a diagram from your D2 code, it calculates the vector paths. It defines the curves of the arrows mathematically. It ensures that the text elements are real text strings embedded in the file, not pictures of text.
Ensuring Crisp Text at Any Size
This guarantees that when you export from our tool, your documentation is future-proof. No matter what screen technology comes out next year, your diagram will look crisp.
Use Cases for SVG Exports
Where should you use these files?
GitHub READMEs (Light/Dark Mode compatibility)
GitHub renders SVGs natively. This allows for advanced tricks like transparent backgrounds that look good in both Light Mode and Dark Mode. A white-background PNG looks terrible in Dark Mode. A transparent SVG adapts.
Printed Research Papers and Theses
If you are writing a paper, you need vector graphics. Printers operate at incredibly high resolutions (300 DPI or higher). SVGs ensure your printed lines are smooth.
Developer Presentations
When you are projecting on a massive screen in a conference room, you do not want your audience squinting at blurry artifacts. SVG ensures your presentation looks professional.
By switching to SVG, you are essentially upgrading the “resolution” of your entire documentation suite. Stop thinking in pixels. Start thinking in vectors.
The Programmable Diagram: A Developer’s Guide to D2 and Text-Based Visuals
For a deeper dive into the revolutionary world of text-based diagramming and how tools like D2 are setting new standards for technical documentation, explore our comprehensive guide: The Programmable Diagram: A Developer’s Guide to D2 and Text-Based Visuals.