· Engineering Management · 4 min read
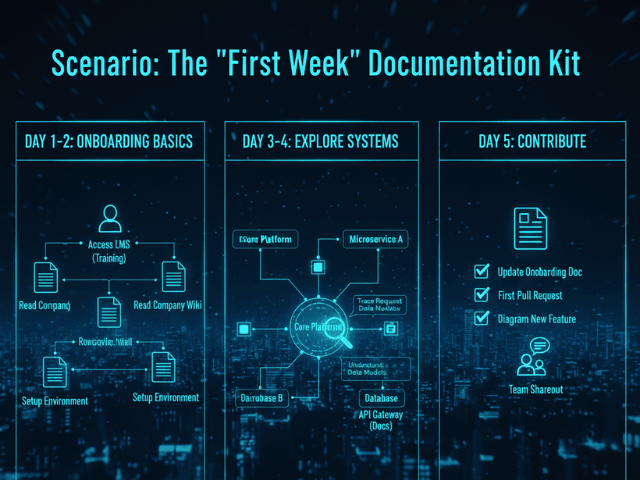
Scenario: The "First Week" Documentation Kit
This scenario describes how to quickly create a documentation kit for new engineers using AI Diagram Maker, reducing ramp-up time by visualizing architecture, data, and core flows.
You finally hired that Senior Engineer you have been looking for. They start next Monday. You want them to hit the ground running. You want them to ship code in their first week. But you look at your repo. The README.md is empty except for “Project X: It works on my machine.” The Wiki has not been updated since 2021. If you throw them into this mess they will spend their first week just trying to figure out how to run the app. They will annoy you with questions every five minutes. “Where is the database config?” “What service calls the payment gateway?” You need to create a Documentation Kit. A set of maps that explain the territory.
The Situation: A New Senior Engineer is Joining
Senior engineers do not need hand-holding but they do need context. They need to know the architectural constraints. They need to know:
- The High Level: How do the services talk to each other?
- The Data: How is the database structured?
- The Core Flow: How does the main transaction logic work? Creating this manual documentation would take you all week. You do not have a week. You have Friday afternoon.
The Goal: Reduce Ramp-Up Time
Your goal is to create three key diagrams that answer 90% of their questions. You want these diagrams to live in the repo so they see them immediately when they clone the code.
The Workflow:
Here is how you use AI Diagram Maker to build the kit in one hour.
Generating Architecture, ERD, and Core Flow Diagrams
1. The Architecture (30 mins) You type your stack into the tool. “React Frontend talks to Node API. API uses Redis and Postgres. Everything runs in Docker.” The AI generates a System Architecture diagram. It shows the boundaries. This helps clarify if you are working with a Microservices vs. Monolith structure.
Diagram
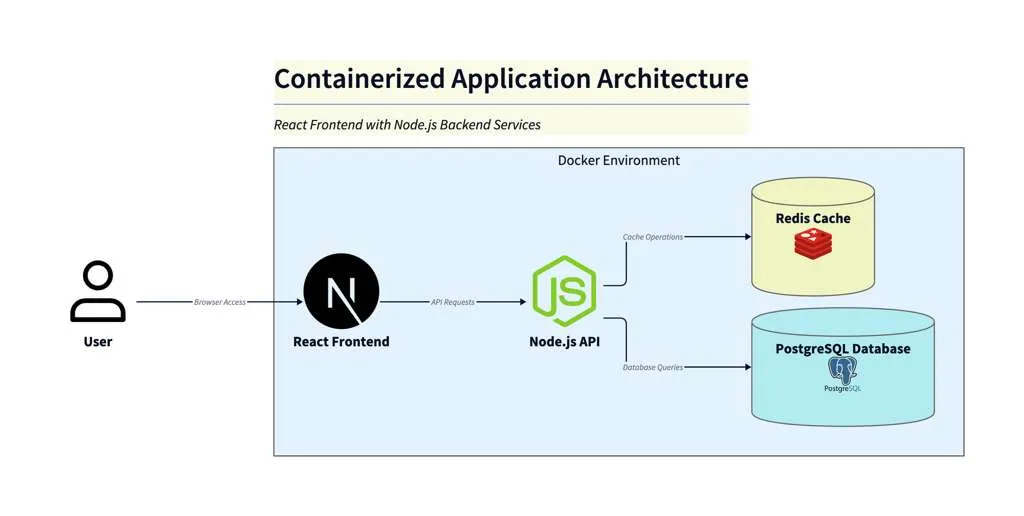
Diagram Explanation:
This diagram shows a Docker-based application architecture. The user interacts with a React frontend container, which communicates with a Node.js API container. The API container handles business logic and connects to both a Redis container (for caching/session management) and a Postgres container (for persistent data storage). All services run as isolated containers on a single Docker host, enabling easy deployment and scalability.
2. The Data (15 mins) You run pg_dump. You paste the SQL schema into the tool. The AI generates the ER Diagram. You refine it to hide the boring tables and highlight the User and Order tables.
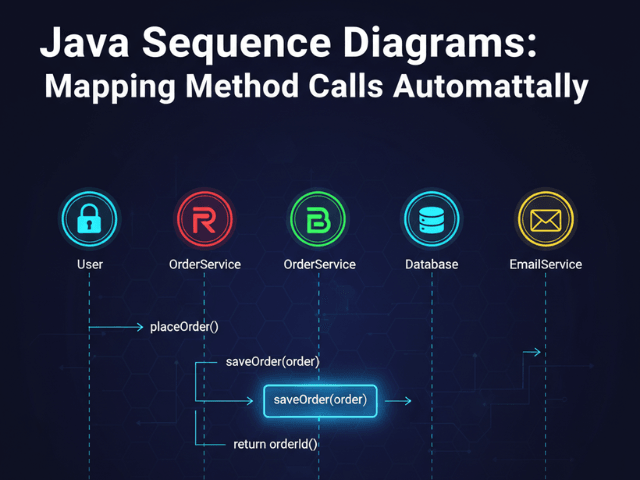
3. The Core Flow (15 mins) You copy the main checkout() function from your controller. You paste it into the tool. The AI generates a Sequence Diagram. It shows the API call, the DB transaction, and the Stripe integration.
Diagram
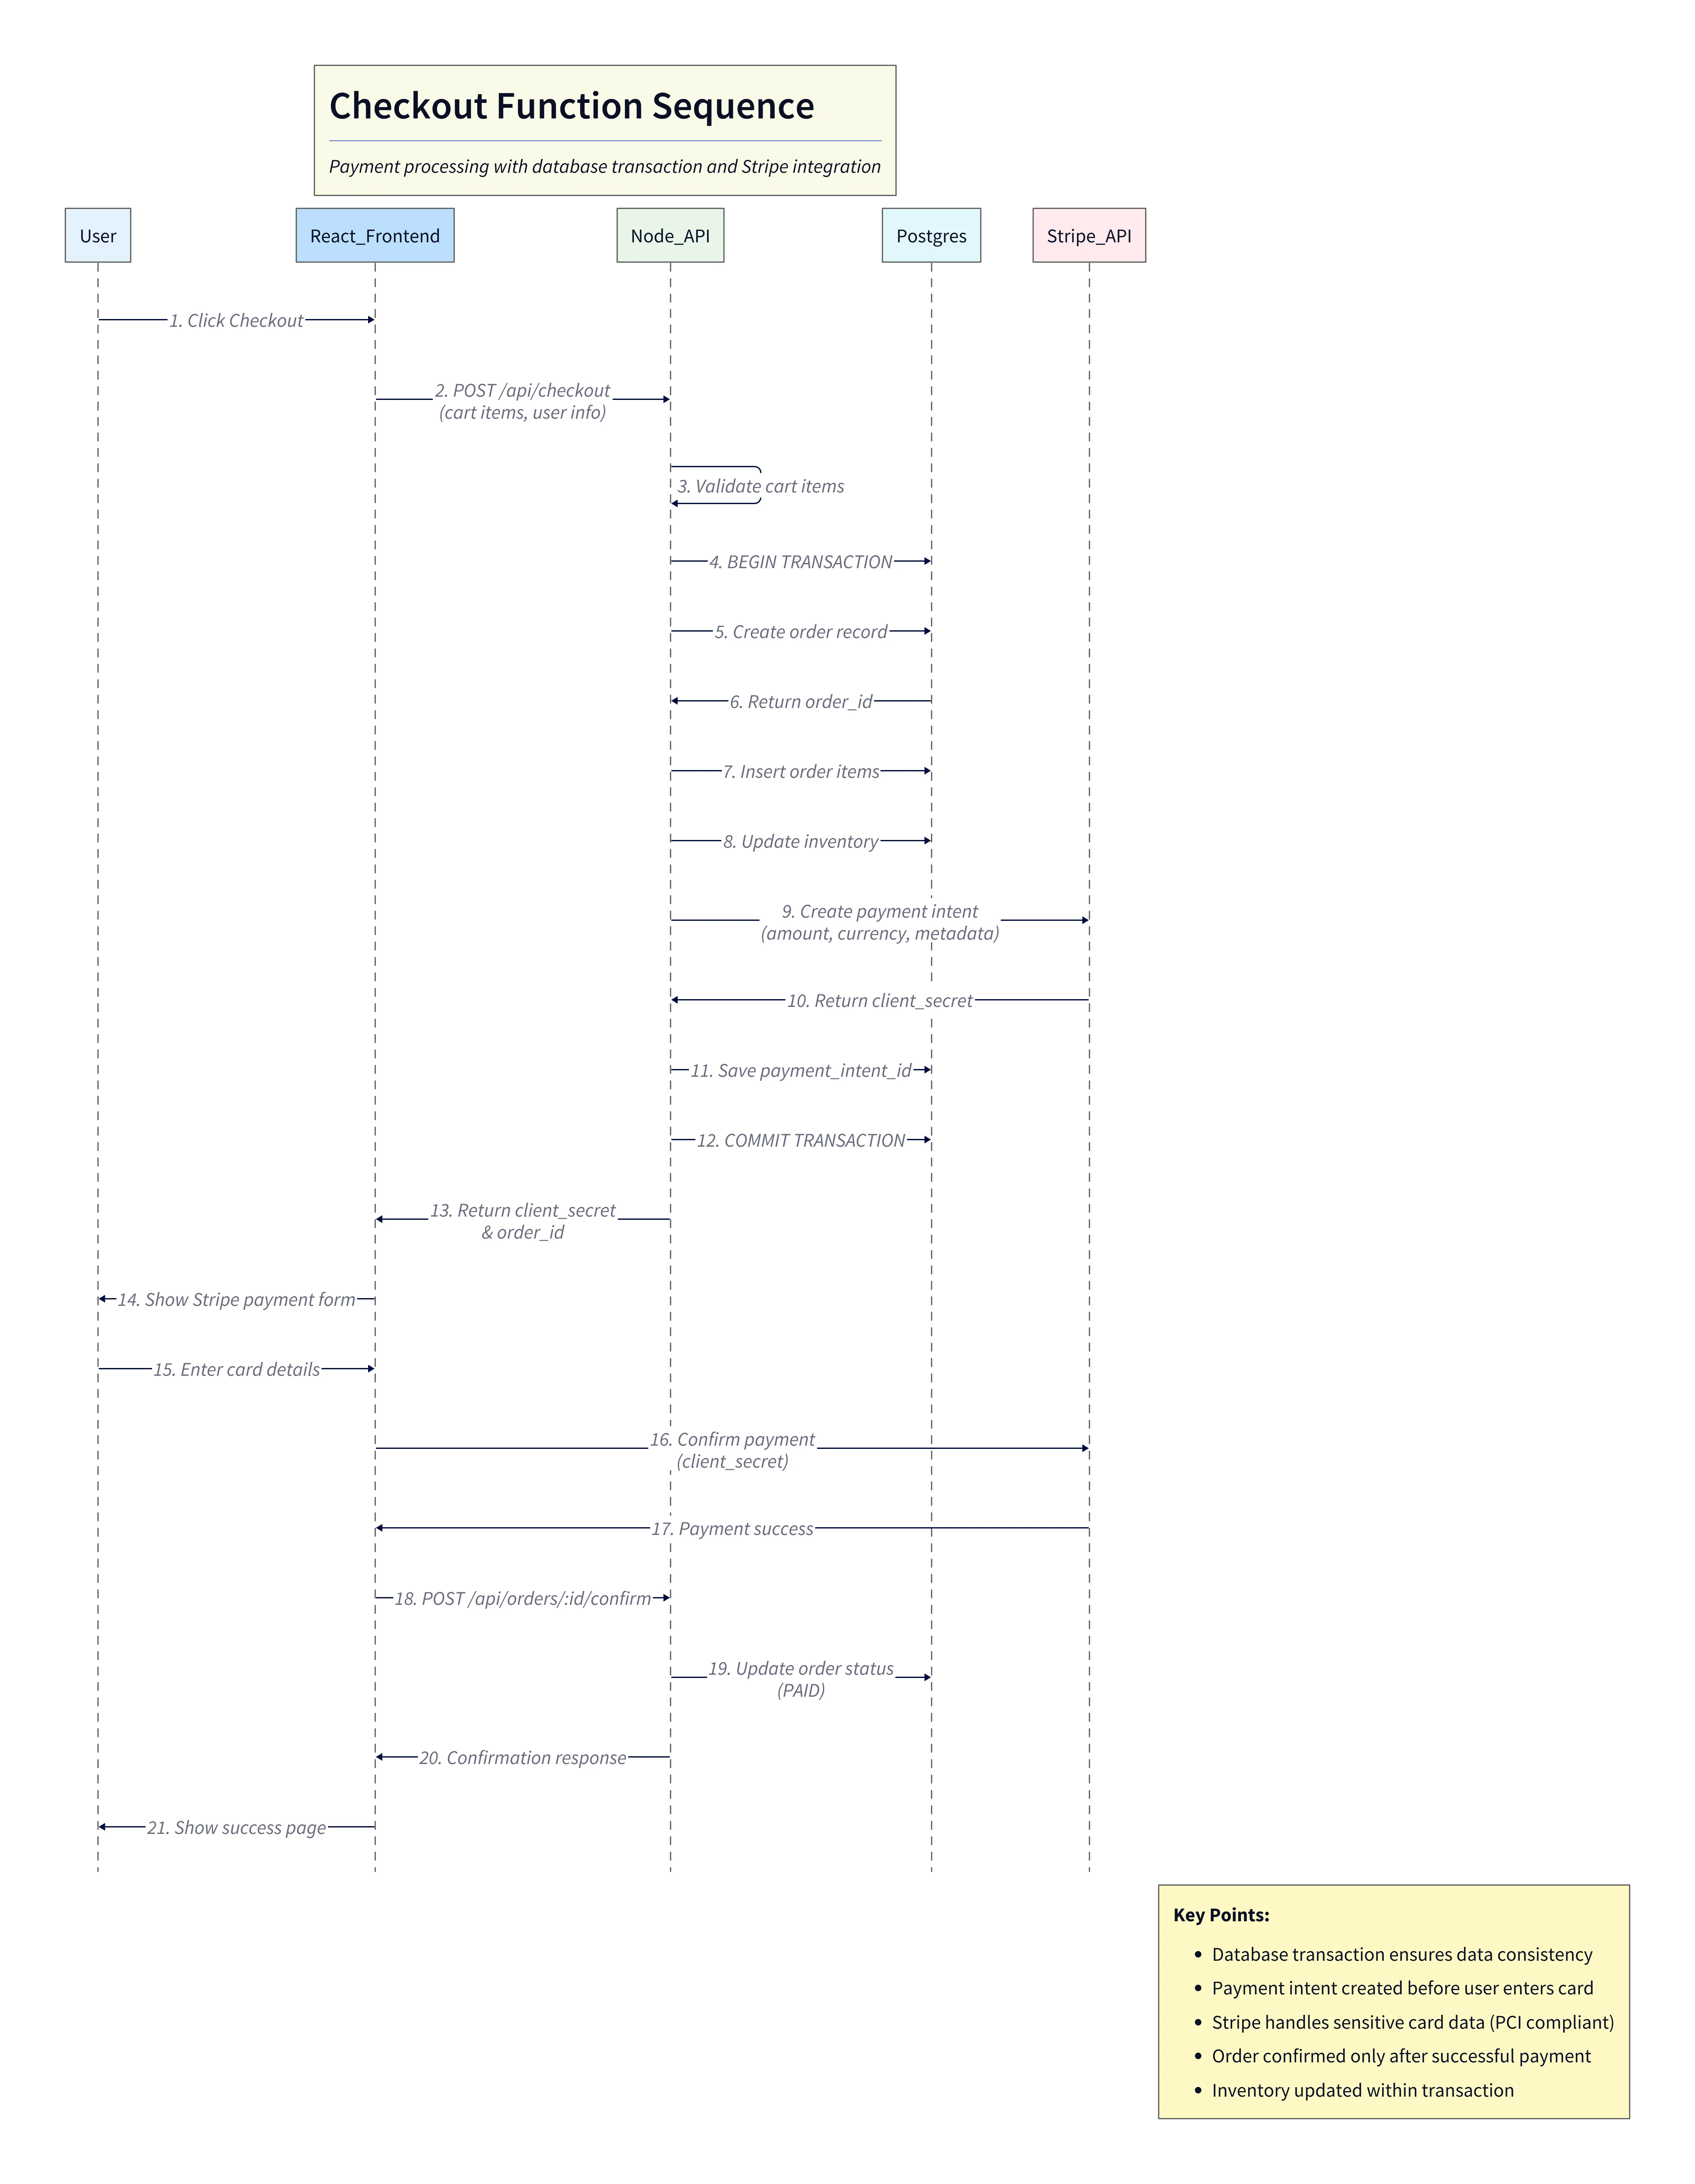
Diagram Explanation:
This sequence diagram visualizes the checkout process. It starts with the user triggering checkout in the frontend, which calls the Node API. The API validates the cart, begins a database transaction, creates the order, updates inventory, and interacts with Stripe to create a payment intent. After payment confirmation, the order status is updated and the user sees a success page. The diagram highlights the flow of data and the integration between the API, database, and Stripe for secure, consistent order processing.
Committing them to the Repo (Manual Workflow)
You export the three SVGs. You create a folder docs/onboarding. You save the files there. You update the README.md to display them right at the top.
You commit and push. This aligns perfectly with the “Export & Commit” workflow ensuring version control for your visuals.
The Result: A Self-Serve Onboarding Experience
On Monday the new hire clones the repo. They read the README. They see the diagrams. “Oh cool,” they say. “So we are using Redis for session storage. And the Order table links to Payments here.” They understand the system before they even run npm install. You did not have to spend four hours whiteboarding. The documentation did the work for you.
Create your kit. Give your new hires the context they deserve. Use AI Diagram Maker to generate a complete documentation suite in under an hour. It is the best welcome gift you can give a developer.
The Programmable Diagram: A Developer’s Guide to D2 and Text-Based Visuals
For more on creating maintainable documentation, check out our guide: The Programmable Diagram: A Developer’s Guide to D2 and Text-Based Visuals.