· Development · 14 min read
The Complete Guide to Architecture Diagram Types - When to Use Each One
A practical reference for software architecture diagrams covering flowcharts, sequence diagrams, ERDs, network diagrams, and more. Learn when to use each diagram type to transform complex technical design into effective communication.

Welcome to your practical reference for software architecture diagrams — the visual maps teams use to explain how a system is constructed, how components interact, and how data flows through an application. If you’ve ever asked which diagram type best fits a given problem, this guide answers that question with clear examples and action-oriented advice.
Choosing the right diagram transforms complex technical design into effective communication. A well-chosen architecture diagram helps your team spot hidden dependencies, shortens onboarding, and gives stakeholders an accurate view of system structure; the wrong diagram can create confusion and slow decisions.
Throughout this guide you’ll find the most useful diagram types — flowchart, architecture (system and application views), sequence, ERD, network, workflow, UML class diagrams, and mind maps — and when to use each so your teams and stakeholders get the right level of detail.
Whether you’re a developer, architect, product manager, or business stakeholder, you’ll get practical advice on purpose, audience, and tooling. We’ll also include short examples showing how a single diagram resolved a real planning bottleneck (teaser: a sequence + ERD combo prevented a data migration rollback) and pointers to tools that speed diagramming and deployment decisions.
Key Takeaways
- Software architecture diagrams turn system complexity into shared understanding
- Pick the diagram type that matches your audience and communication goal
- Different types reveal different relationships — components, interactions, data, and deployment
- Modern tools and AI-assisted diagramming help teams produce consistent, shareable visuals faster
- Knowing when and why to use each type is as important as knowing how to draw it
- Practical examples and templates in the guide help developers, teams, and stakeholders collaborate more effectively
Introduction to Software Architecture Diagrams
Effective project visualization starts by choosing the right software architecture diagrams for the problem you need to solve. These visual tools act as blueprints for your system, helping teams and stakeholders understand structure, components, and data flows across applications and deployments.
What They Are and Why They Matter
Think of architecture diagrams as maps of your software system: they show which components exist, how they connect, and where data travels. These diagrams help developers spot integration points and dependencies while giving non-technical stakeholders a clear view of the entire system without reading code.
For teams, diagrams improve communication and reduce mistakes. A concise system diagram can shorten onboarding, make design reviews faster, and help developers see how a change affects other components. For example, a well-drawn ERD plus a sequence diagram often prevents data-model mismatches during migrations.
Visuals also improve collaboration: when everyone views the same diagram, architects, product managers, and operations staff can align on priorities, surface potential bottlenecks, and agree on deployment and monitoring plans.
Overview of Diagram Types and Their Roles
Different diagram types serve different goals. High-level architecture diagrams show the entire system and are ideal for stakeholder briefings. Sequence and flowchart diagrams show interactions and decision points for developers and QA. ERDs focus on data relationships for database design, while network and deployment views detail runtime topology for operations and DevOps teams.
When choosing a type, match the diagram to the audience and the question you need to answer: use an architecture diagram to explain system structure, a sequence diagram to trace interactions over time, a network diagram to plan cloud architecture and deployment, and a mind map to brainstorm components and requirements.
For specifics on deployment views, system-level diagrams, and developer-focused sketches, see the corresponding sections below that dive into tools, templates, and best practices for each diagram type.
Understanding Different Diagram Types
Different scenarios demand specific visual approaches: each diagram type highlights particular aspects of your architecture so you can answer targeted questions about system behavior, data, and deployment. Choose the type that matches the problem you need to solve and the audience who needs to act on the information.
High-Level, System, and Application Diagrams
High-level architecture diagrams show the entire system at a glance — major services, third-party integrations, and how data flows between them. Use these for stakeholder briefings and roadmaps where emphasis is on scope and relationships rather than implementation details.
System diagrams map hardware and software together, revealing runtime topology and how components interact across networks or cloud regions. They help operations and DevOps teams plan deployment and capacity and uncover potential bottlenecks where components interact.
Application-focused diagrams dig into a single application’s internal structure: modules, APIs, data stores, and runtime components. Developers and architects rely on these to design interfaces, reason about dependencies, and estimate the impact of code changes.
Integration and Deployment Perspectives
Integration diagrams show how separate systems exchange data and which interfaces or protocols they use. They’re essential for integration architecture, API design, and planning incremental rollouts across teams or services.
Deployment and network diagrams show where software runs — servers, containers, cloud services, load balancers, and network segments. Use these views to plan deployment architecture, security zones, and disaster recovery.
DevOps visuals often combine pipeline, deployment, and monitoring information to trace code from development through CI/CD to production. Website-structure or application-architecture views focus on navigation, user flows, and component responsibilities for UX and product teams.
Diagram Types Comparison
| Diagram Type | Primary Focus | Best For | Key Components |
|---|---|---|---|
| Flowchart | Decision points and process steps | Process design, onboarding, QA | Decisions, steps, conditional paths |
| Architecture (High-Level) | System structure and relationships | Stakeholders, planning | Services, integrations, data flows |
| Sequence | Interactions over time | Designing workflows, APIs, debugging | Actors, messages, lifelines, timing |
| ERD | Data model and relationships | Database design, migrations | Entities, attributes, foreign keys |
| Network | Topology and connectivity | Ops, cloud architecture, security | Routers, subnets, firewalls, endpoints |
| Workflow | Process and task orchestration | Business process design, automation | Tasks, transitions, roles |
| UML Class | Object structure and relationships | Software design, API contracts | Classes, properties, methods, associations |
| Mindmap | Ideation and component brainstorming | Early design, requirements gathering | Nodes, sub-nodes, topics |
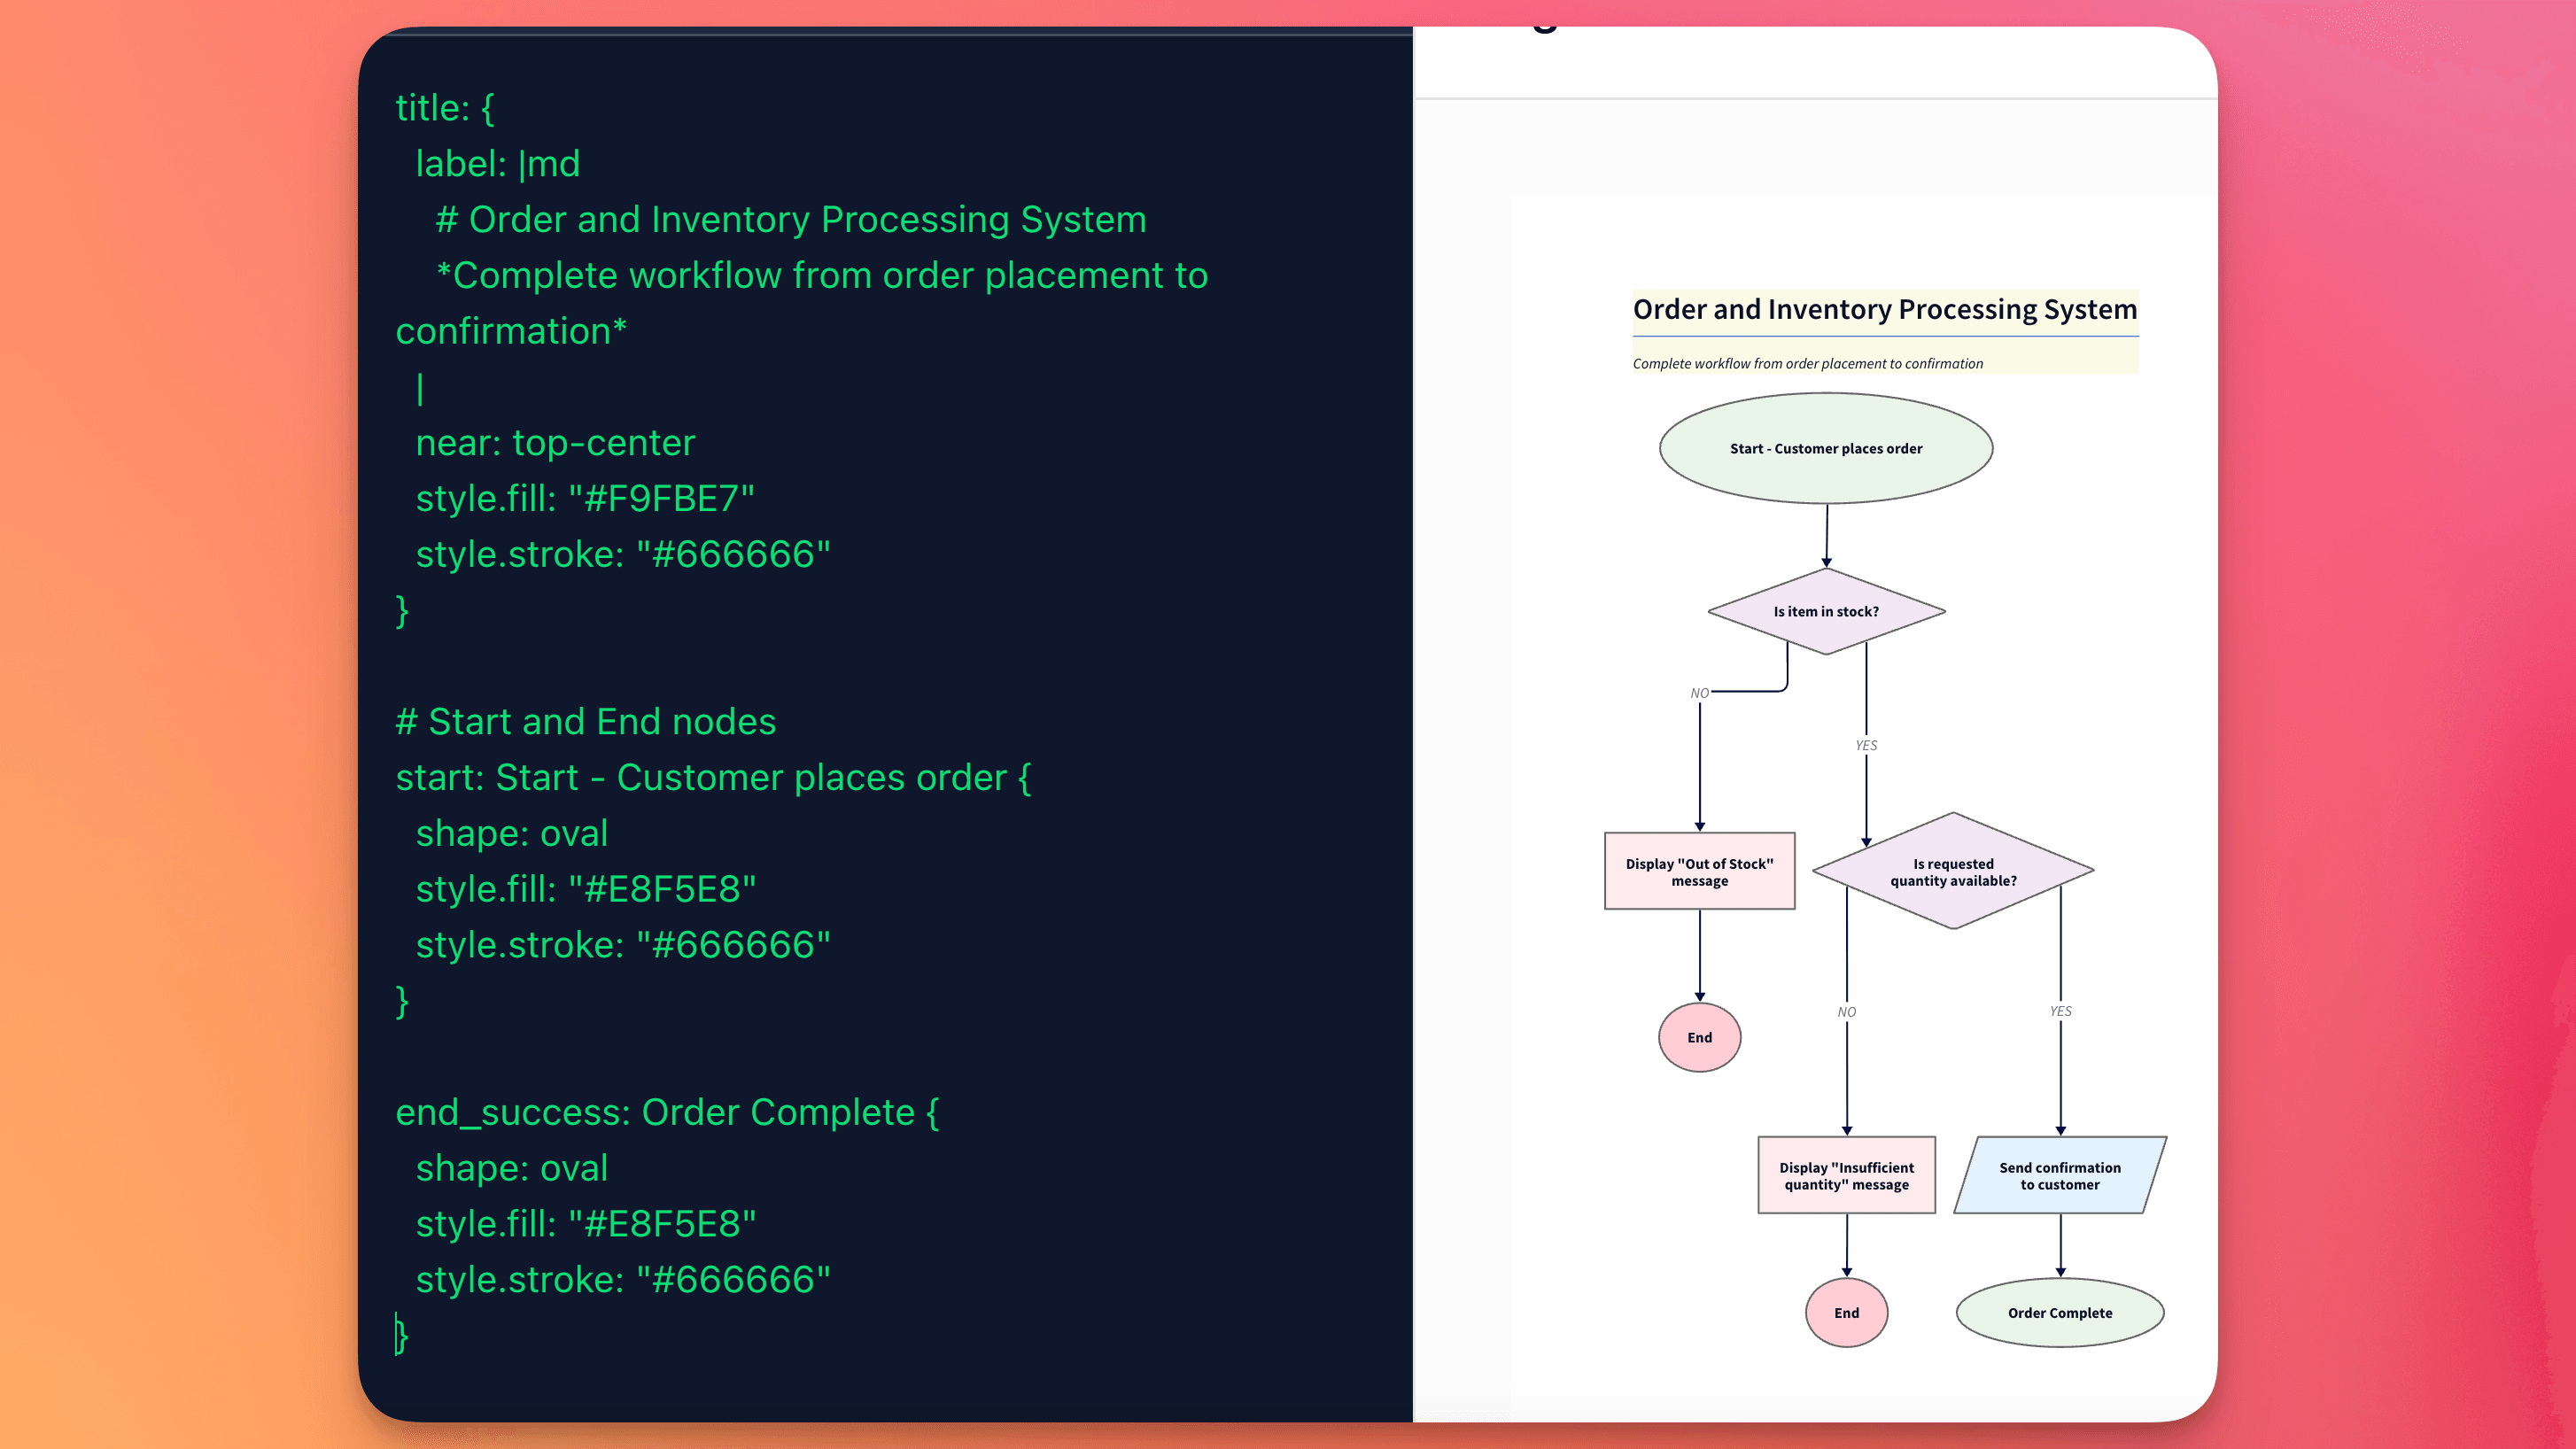
Use short example scenarios to pick the right type: a flowchart for user signup decision logic; a sequence diagram to trace an OAuth login flow; an ERD for order/invoice/customer relations; a network diagram to lay out cloud architecture. Often you’ll combine perspectives — e.g., an architecture diagram plus a sequence diagram clarifies both structure and behavior.
Understanding these differences makes it easier to choose the right diagrams for planning, documentation, and communication so teams, developers, and stakeholders can act with confidence.
Drawing Your Software Architecture Diagrams
Creating clear software architecture diagrams starts with a repeatable process. A structured approach ensures your visuals communicate the right details to the right audience — from high-level system overviews for stakeholders to code-level diagrams for developers.
Step-by-Step Process for Creating Effective Diagrams
1. Define purpose and audience. State whether the diagram answers a question about system structure, data flows, interactions, or deployment. For example: “Show how payment requests flow from frontend to billing service” (sequence) or “Document database tables and relations” (ERD).
2. Set the scope. Limit scope to one concern per diagram (e.g., authentication flow, network topology, or data model). If you need multiple concerns, plan multiple diagrams and cross-reference them.
3. Inventory components. List services, databases, servers, queues, and external APIs. For each component include a short descriptor: owner, runtime (container/VM), and port or endpoint where relevant. This helps trace dependencies and responsibilities during development and deployment planning.
4. Choose a diagram type and tools. Match type to purpose (flowchart for decision logic, sequence for interactions, ERD for data, network for topology). Pick diagramming tools that export PNG/SVG, support collaboration, and integrate with your docs and code repositories.
5. Draft layout and notation. Place major components first, then draw interactions and data flows. Use consistent symbols and standard notation (UML for class/sequence, ERD conventions for entities, simple boxes/arrows for high-level architecture). Keep labels concise and add a legend for any custom symbols.
6. Review and iterate. Share drafts with developers, ops, and stakeholders. Ask reviewers to check for missing components, incorrect interfaces, or unclear flows. Update the diagram until reviewers can answer the target question confidently.
7. Finalize and share. Add title, version, date, and a short description of the diagram’s intent. Export to PNG/SVG for presentations and embed the original source file in documentation so the diagram remains a living artifact.
Key Tips and Best Practices
Use a checklist: Purpose • Audience • Scope • Components • Layout • Review. Keep this checklist attached to the diagram in your docs.
Favor simplicity: show just enough detail for the audience. For stakeholder views show services and relationships; for developers include interfaces, ports, and code owners.
Make components actionable: when listing components, include owner, endpoint, and any critical dependencies (e.g., “Auth service — team: identity — port: 443 — depends on: user-db”). This makes diagrams useful for troubleshooting and planning deployments.
Version control diagrams: keep the editable source in your repo or design system and export stable images for reports. Tag diagrams with a version and date so teams know when to revalidate.
Use consistent style and reusable components. Define a palette and icon set for services, databases, queues, and external APIs so different diagrams remain readable and comparable.
Mini-Templates by Diagram Type
Flowchart: emphasize decisions and conditional paths; include start/end nodes and happy/error routes.
Sequence: emphasize actors, messages, and timing; annotate key requests and responses.
ERD: emphasize entities, primary/foreign keys, and cardinality; include sample fields for clarity.
Network: emphasize subnets, firewalls, and public/private endpoints; show ingress/egress and load balancers.
Workflow: emphasize tasks, roles, and triggers; show synchronous vs asynchronous steps.
UML Class: emphasize classes, attributes, methods, and associations; annotate access modifiers or serialization details if relevant.
Mindmap: emphasize topics and sub-topics for brainstorming system requirements and components.
Finally, export diagrams in standard image formats (PNG/SVG) for docs and keep the editable source for future changes. Encourage teams to treat diagrams as living documentation — update them as code and deployment architecture evolves so they remain accurate and actionable.
When to Use Architecture Diagrams for Your Projects
Strategically creating software architecture diagrams at the right moments turns complex planning into clear communication and fewer implementation surprises. Consider producing visuals at key phases—planning, onboarding, design reviews, deployments, and post‑incident retros—to keep teams aligned and reduce rework.
New feature planning: sketch a flowchart for decision logic and a sequence diagram for the interaction between services.
Onboarding: provide a high-level architecture diagram plus a mind map of components and responsibilities so new hires see the entire system and their team’s scope quickly.
Deployment rollouts: use network and deployment diagrams to validate cloud architecture, security zones, and failover strategies before cutover.
Introducing AI-Powered Tools for Diagramming
AI is changing how teams create software architecture diagrams by automating layout, style, and repeatable patterns so you can focus on system design instead of manual drawing. These tools speed diagramming, improve consistency across diagrams, and help teams produce shareable visuals that reflect the current system structure.
Development teams use AI to translate plain-English descriptions or structured inputs into clear visuals, bridging the gap between ideas and diagrams. The result: faster iteration, more consistent component representations, and easier collaboration across teams and stakeholders.
How AIDiagramMaker Uses AI to Simplify Diagram Creation
AIDiagramMaker is an example of an AI-assisted diagramming tool that generates styled architecture diagrams from textual descriptions or imports. You describe components and interactions in simple language (or paste a spec) and the tool suggests a layout, symbols, and connections that follow common notations.
That automation removes much of the manual work — arranging components, spacing, and alignment — so you get professional-looking visuals quickly without deep design skills. Use the generated diagram as a starting point, then refine labels, interfaces, and ownership details with your team.
Automatically Generating Clean, Styled Architecture Diagrams
AI handles layout decisions and component spacing, producing a clear visual hierarchy automatically. You can iterate by changing the description (for example, add “include caching layer between API and DB”) and regenerate alternate views to compare options.
AI-based generation doesn’t replace domain expertise: architects and developers still verify the system structure, interfaces, and data flows. The AI simply removes friction and helps teams explore design variations faster.
Traditional vs AI-Powered Approaches
| Scenario | Traditional Approach | AI-Powered Solution |
|---|---|---|
| Multiple diagrams needed | Manually copy and adapt layouts | Rapid generation from a single description with variations |
| Tight deadlines | Rushed, inconsistent visuals | Consistent, exportable diagrams in minutes |
| Team communication | Time spent explaining notation | Readable visuals with standardized symbols everyone recognizes |
AI-powered diagramming is especially valuable under pressure: when you need to document a system quickly for a deployment, incident review, or stakeholder demo, these tools keep the diagram accurate and presentable.
Enhancing Communication Across Teams
AI-generated diagrams help create a shared language across product, engineering, and operations by standardizing how components and interactions are shown. That clarity reduces integration problems because teams can see dependencies and responsibilities at a glance.
When your system architecture spans multiple applications and deployment environments, AI tools make it easier to produce consistent views — high-level architecture maps for business stakeholders, sequence diagrams for developers, ERDs for DBAs, and network diagrams for ops — all derived from the same source description.
How to Evaluate AI Diagram Tools (Quick Checklist)
Accuracy: Does the tool produce correct relationships and data flows? Verify against your system model.
Export formats: Can you get PNG, SVG, and the editable source file for version control?
Collaboration: Does it integrate with your docs, repos, or team workspaces?
Notation support: Does it support UML, ERD conventions, and common architecture icons for cloud providers?
Prompt Examples
Try these one-liners to see how fast an AI tool can give you an initial diagram you can refine:
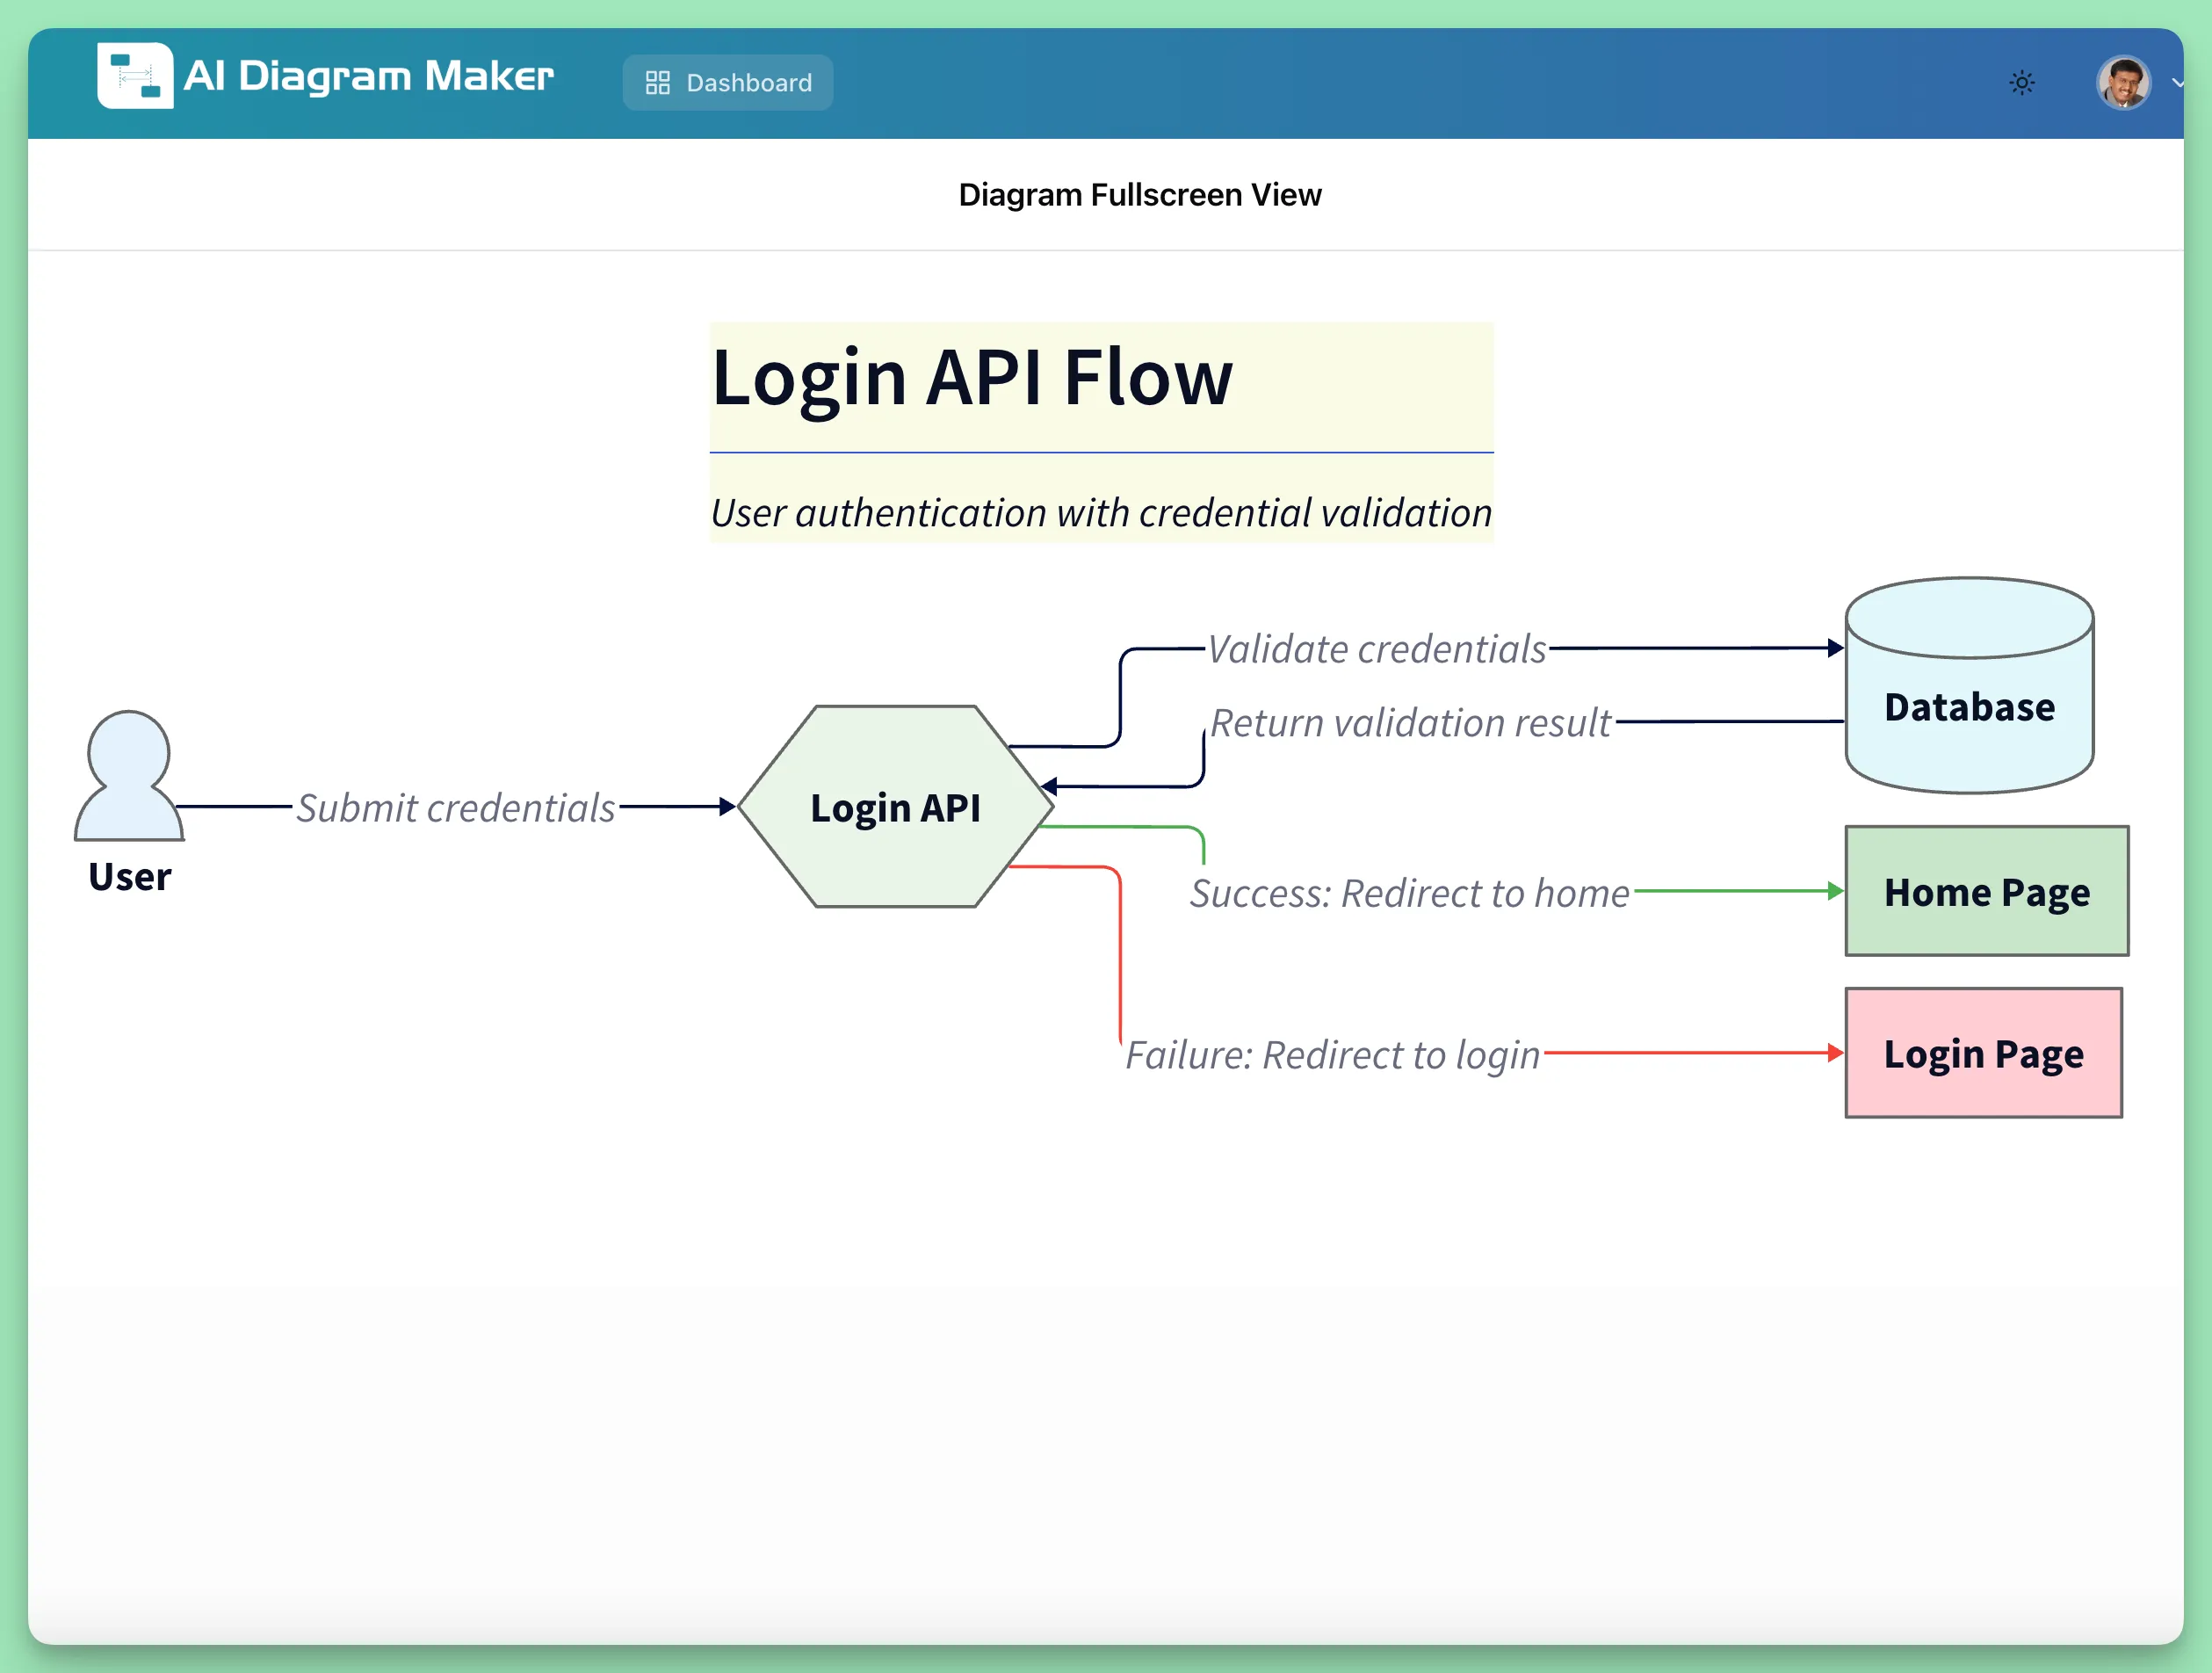
- Flowchart: “user calls login api, it validates credentials with database. if success redirects to home, if failure redirects to login”
AI DiagramMaker creates following diagram for the above prompt
Sequence: “Generate a sequence diagram for OAuth login: client, auth server, resource server, and user DB.”
ERD: “Create an ERD for an e-commerce system with Customer, Order, Product, OrderItem, and Inventory entities.”
For production use, always validate generated diagrams with your architects and operations teams and keep the editable source under version control so diagrams evolve with your deployment architecture.
Conclusion
Choosing the right architecture diagram turns complex software and system design into clear communication that accelerates decision-making across teams. Each diagram type — from flowcharts and sequence diagrams to ERDs, network maps, UML class diagrams, and mind maps — highlights different aspects of your system and supports different stakeholders.
Modern tools and AI-assisted diagramming have made it easier to produce consistent, shareable visuals that reflect your current deployment and design. Use these tools to generate an initial view, then validate details with architects and developers so diagrams remain accurate and actionable.
Use diagrams throughout the development lifecycle: plan features with flowcharts and architecture diagrams, document data models with ERDs, prepare deployments with network and deployment diagrams, and onboard teams with concise system overviews and mind maps. Keep diagrams versioned and embedded in your documentation so they evolve with the system.
Action step: pick one diagram type that fits your next meeting (for example, sketch a sequence diagram for a new API flow or a flowchart for a business decision), create a minimal version, and share it with the team. Templates and quick prompts in this guide will help you start fast and improve collaboration across stakeholders and teams.
FAQ
What are the main benefits of using architecture diagrams?
Architecture diagrams bring clarity to a software system by showing components, relationships, and data flows. They help teams spot dependencies, improve communication with stakeholders, and speed decisions during design, deployment, and incident response. Example: an ERD plus sequence diagram prevented a migration rollback by exposing a missing foreign-key constraint.
How do I choose the right type of diagram for my project?
Start with the question you need to answer. Use high-level architecture diagrams to show the entire system to stakeholders; use sequence diagrams to trace interactions over time; use ERDs for data models; use network/deployment diagrams for cloud architecture and operations. Match detail to audience: developers need interfaces and dependencies; stakeholders need scope and impact.
Which diagram types should I consider and when?
Quick guide: Flowchart (decision logic), Architecture (system overview), Sequence (interaction order), ERD (data relationships), Network (topology), Workflow (process orchestration), UML Class (object design), Mindmap (ideation). Choose one based on whether you’re explaining processes, structure, data, connectivity, or brainstorming requirements.
What’s the easiest way to create a professional-looking diagram?
Use diagramming tools with templates and export options; consider AI-assisted tools to generate an initial layout from text and then refine. Ensure the tool supports PNG/SVG export and editable source files so diagrams can be versioned and updated.
Who should be involved in creating these diagrams?
Collaboration is key: involve developers, system architects, operations, and relevant stakeholders. Keep the diagram owner and reviewers listed on the diagram so responsibilities and updates are clear.