· AI · 4 min read
Converting Whiteboard Sketches to Digital Diagrams - A Practical Guide
A practical guide on converting hand-drawn diagrams from whiteboards and notebooks into editable digital formats. Learn about different approaches, tools, and real-world workflows that work.
You know that moment when you’re in a design meeting, marker in hand, and the ideas are just flowing? You sketch out the architecture, draw some boxes and arrows, everyone nods, and you snap a quick photo. Great session.
Then you get back to your desk and… ugh. Now you’ve got to spend the next 45 minutes painstakingly recreating that whiteboard masterpiece in Lucidchart. Every. Single. Box. I’ve been there way too many times, and honestly, it’s the kind of busywork that makes you wonder why we don’t have a better solution in 2025.
Good news: we finally do. AI can now handle the grunt work of converting those sketches into actual digital diagrams. I’ve been testing different approaches, and this guide breaks down what actually works.
The Problem with Manual Conversion
The traditional workflow looks like this:
- Sketch ideas on whiteboard/paper during discussion
- Take a photo for reference
- Open your diagramming tool of choice
- Manually recreate each box, arrow, and label
- Adjust layout and formatting
This process has several issues:
- Time-consuming: Even simple diagrams take 20+ minutes to recreate
- Error-prone: Easy to miss details or misinterpret your own handwriting
- Breaks flow: The delay between ideation and documentation means context gets lost
- Discourages iteration: Nobody wants to redraw everything when requirements change
Modern Approaches to Digitization
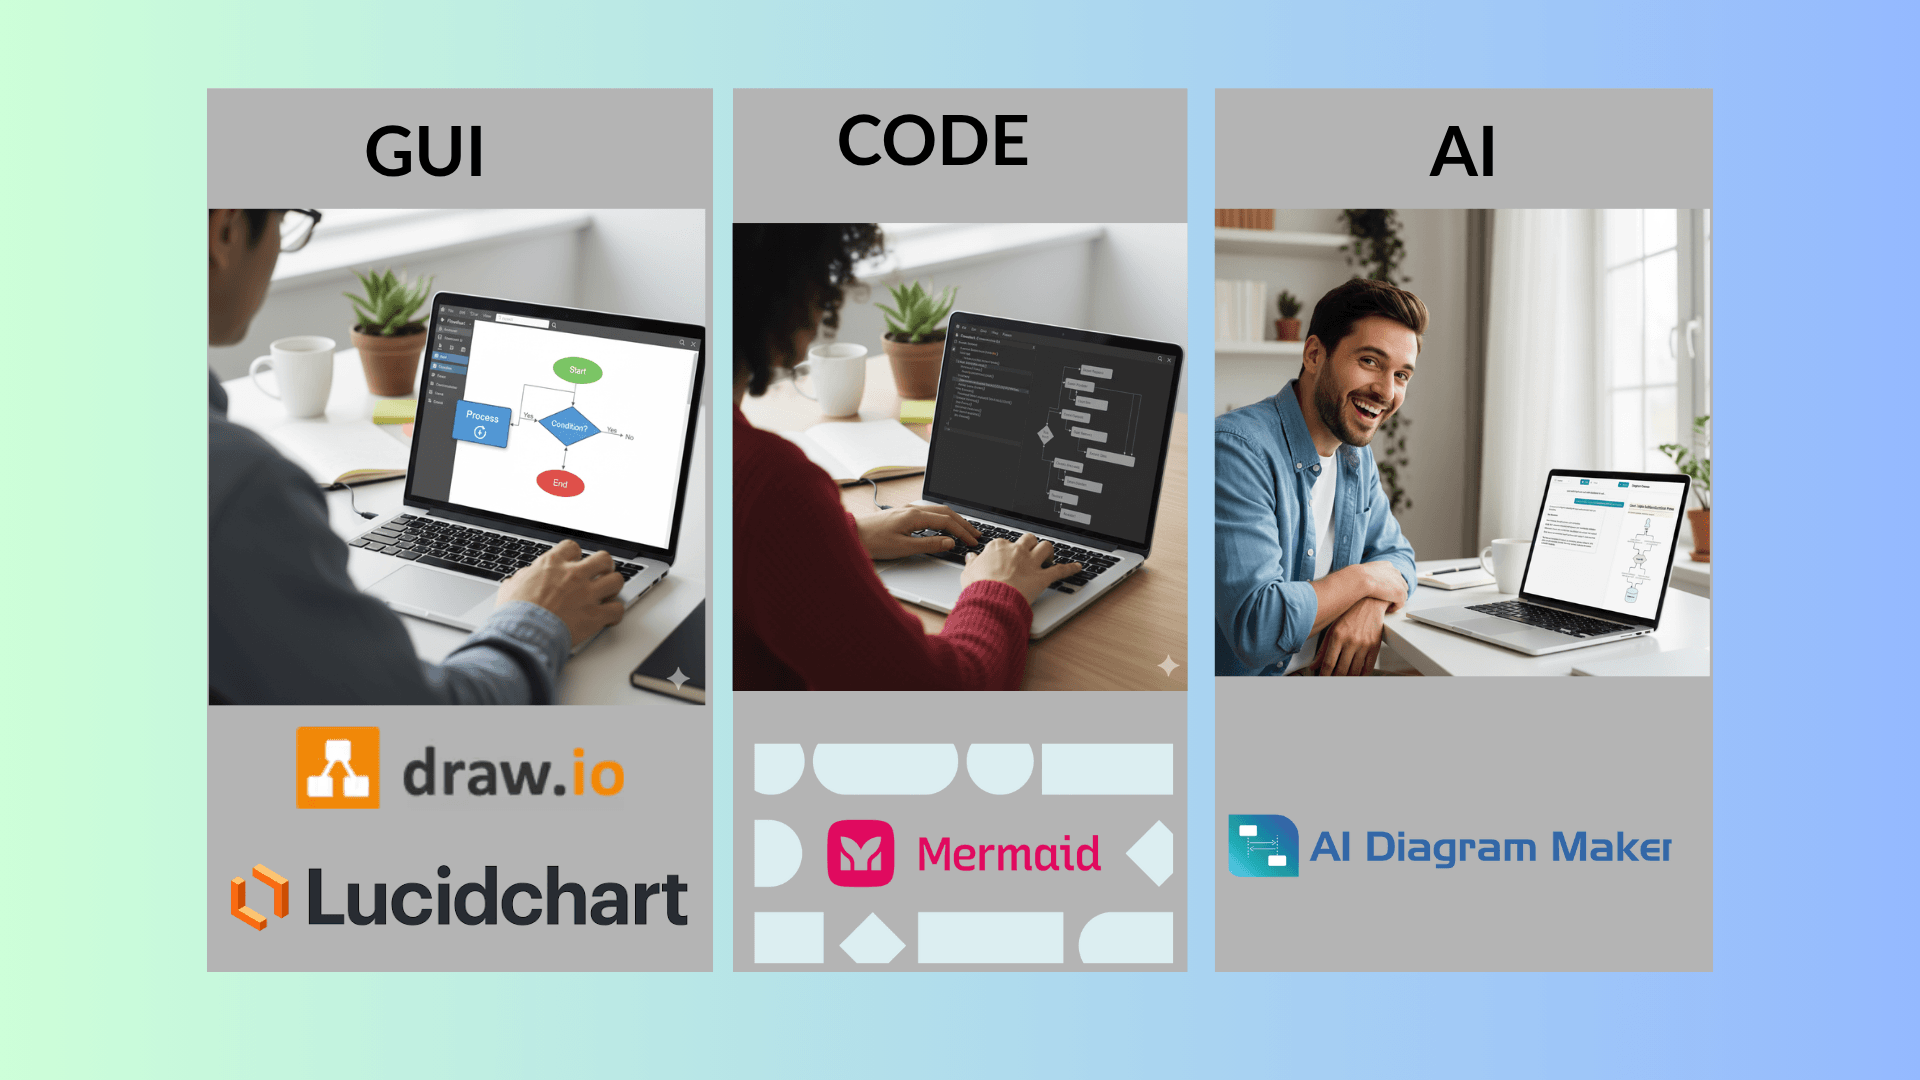
There are a few different approaches available now, each with tradeoffs:
1. OCR-Based Tools
Traditional OCR tools like Microsoft Lens or Adobe Scan can capture text from images, but they struggle with diagram structure. They’re better suited for documents than visual diagrams.
2. AI Vision Models
Newer AI-powered tools leverage vision models (like GPT-4 or Claude) to understand diagram context and regenerate them. Tools in this category include AIDiagramMaker, and various diagram-as-code generators.
A Practical Workflow
Here’s a workflow that has proven effective after testing different approaches. This guide uses AIDiagramMaker as an example, but the principles apply to similar tools:
Step 1: Capture Your Sketch
Take a clear photo of your whiteboard or notebook. A few tips:
- Ensure good lighting and minimal glare
- Capture the entire diagram in frame
- Make sure text is legible in the photo
Step 2: Choose Your Output Format
Think about what you need:
- Flowcharts for process flows
- Entity-Relationship Diagrams for database schemas
- Sequence diagrams for API interactions
- Architecture diagrams for system design
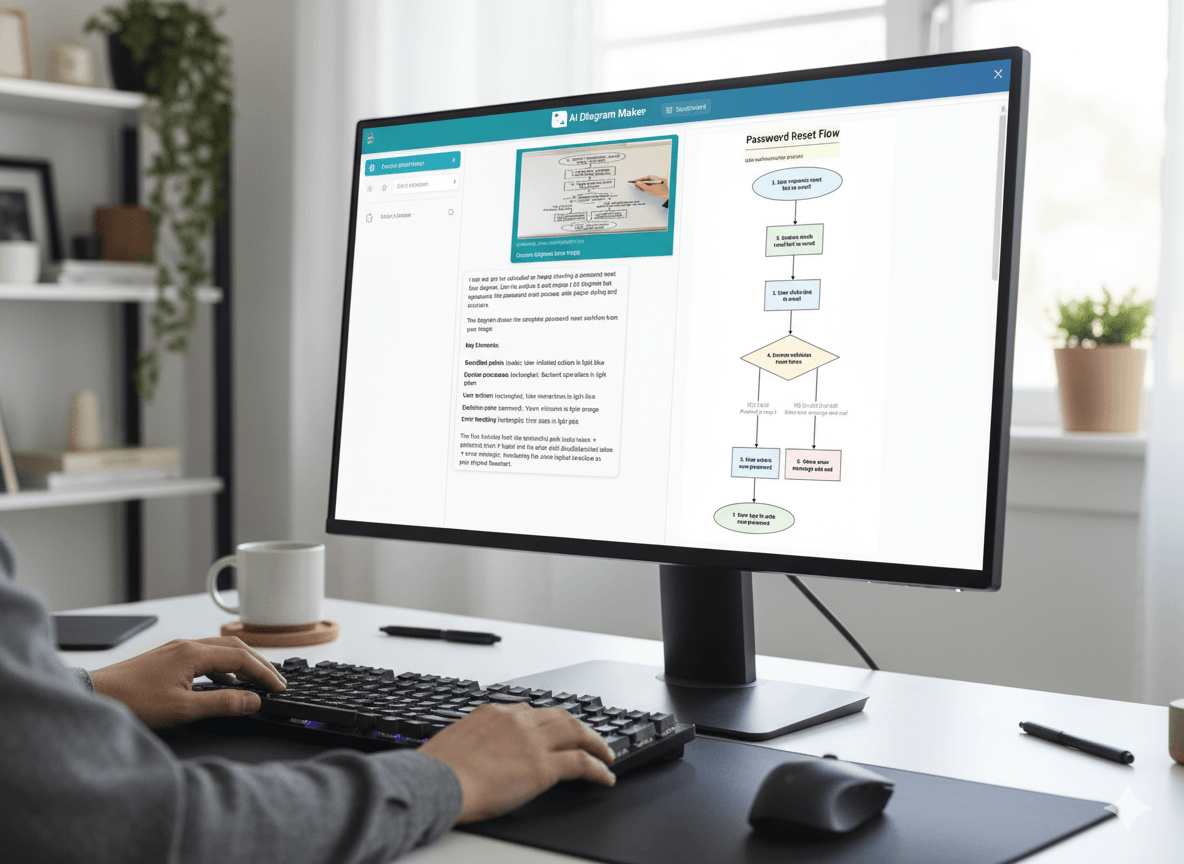
Step 3: Generate and Refine
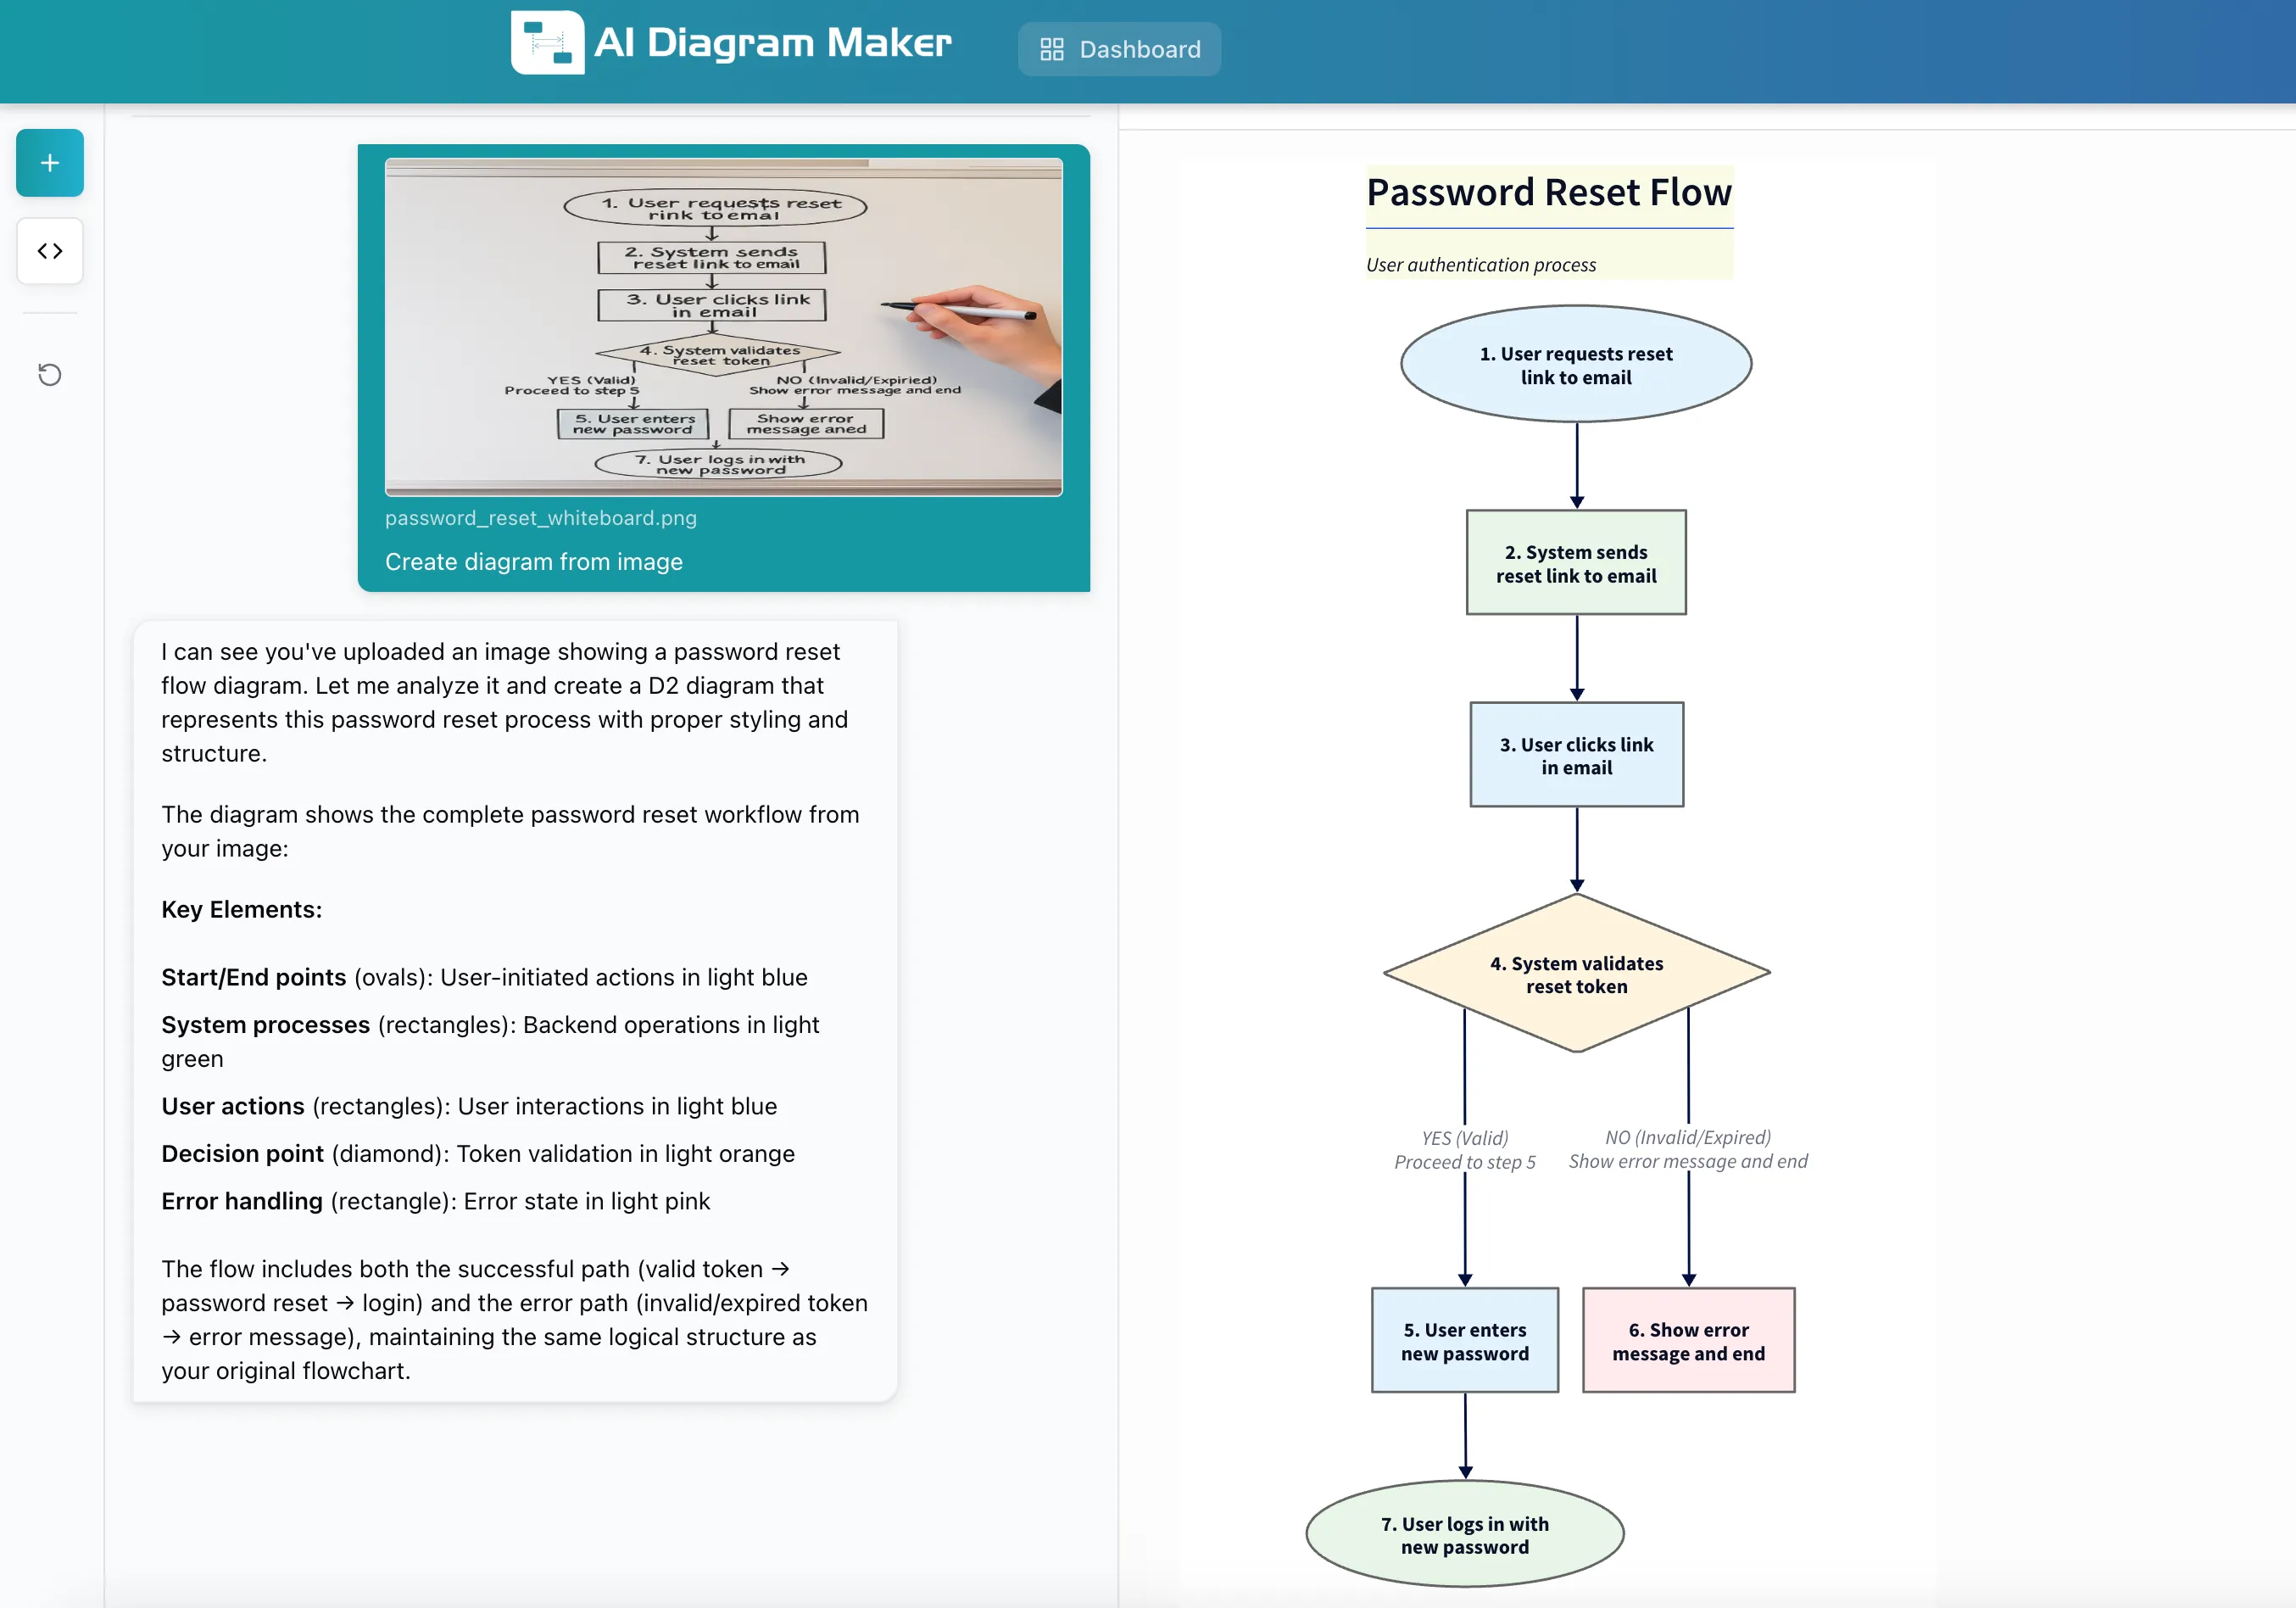
Upload your image to your chosen tool. With AIDiagramMaker, you select “Create diagram from image” and it analyzes the sketch to generate a structured diagram.
The initial output usually gets you 80% of the way there. You’ll likely need to:
- Clarify ambiguous labels
- Add details that weren’t in the original sketch
Demonstration Examples
Here are two practical scenarios that showcase the conversion process:
Example 1: Password Reset Flow
Consider a typical scenario where a team sketches out a password reset flow during a security review:
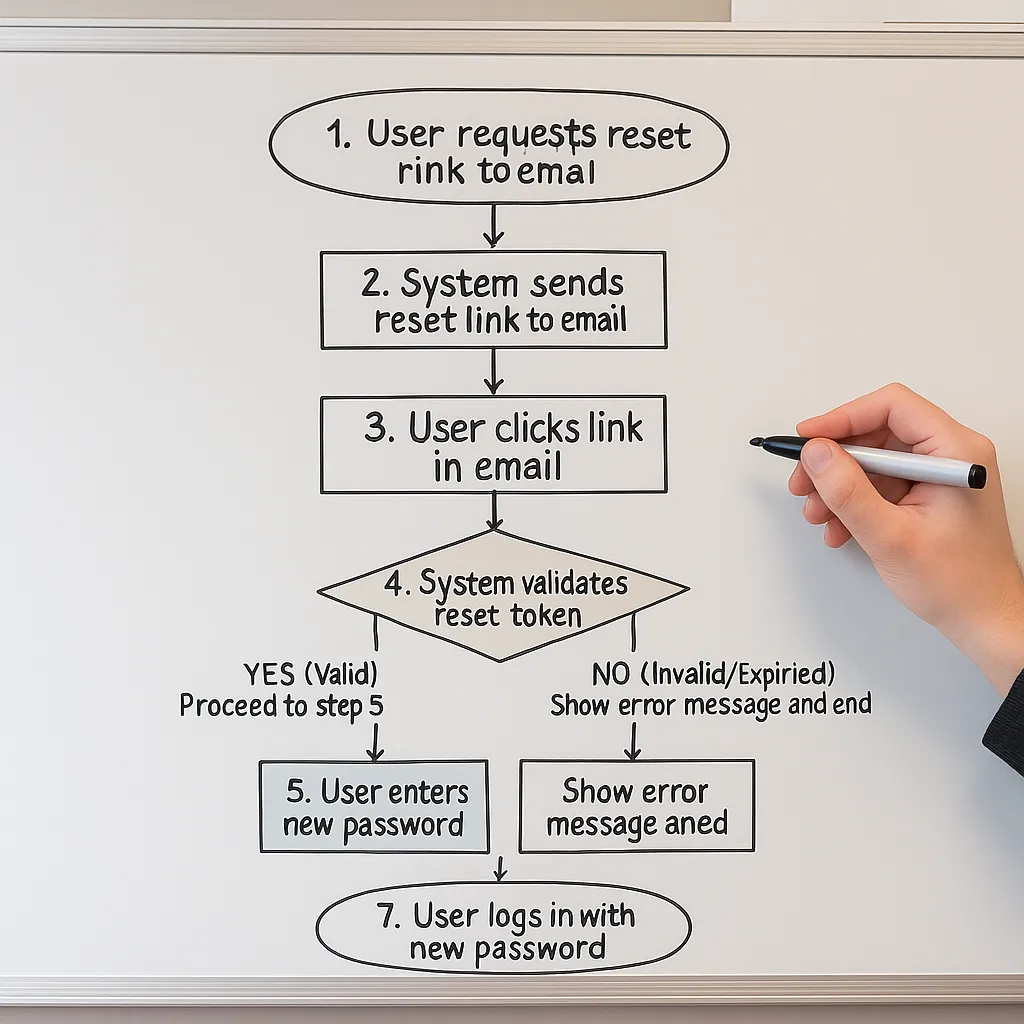
AI tools can interpret the flow and generate a clean flowchart. The digital version can then be refined as needed.
Example 2: Database Schema Design
When designing a blogging system, teams often start with rough sketches showing entities like Users, Posts, and Comments with their relationships:
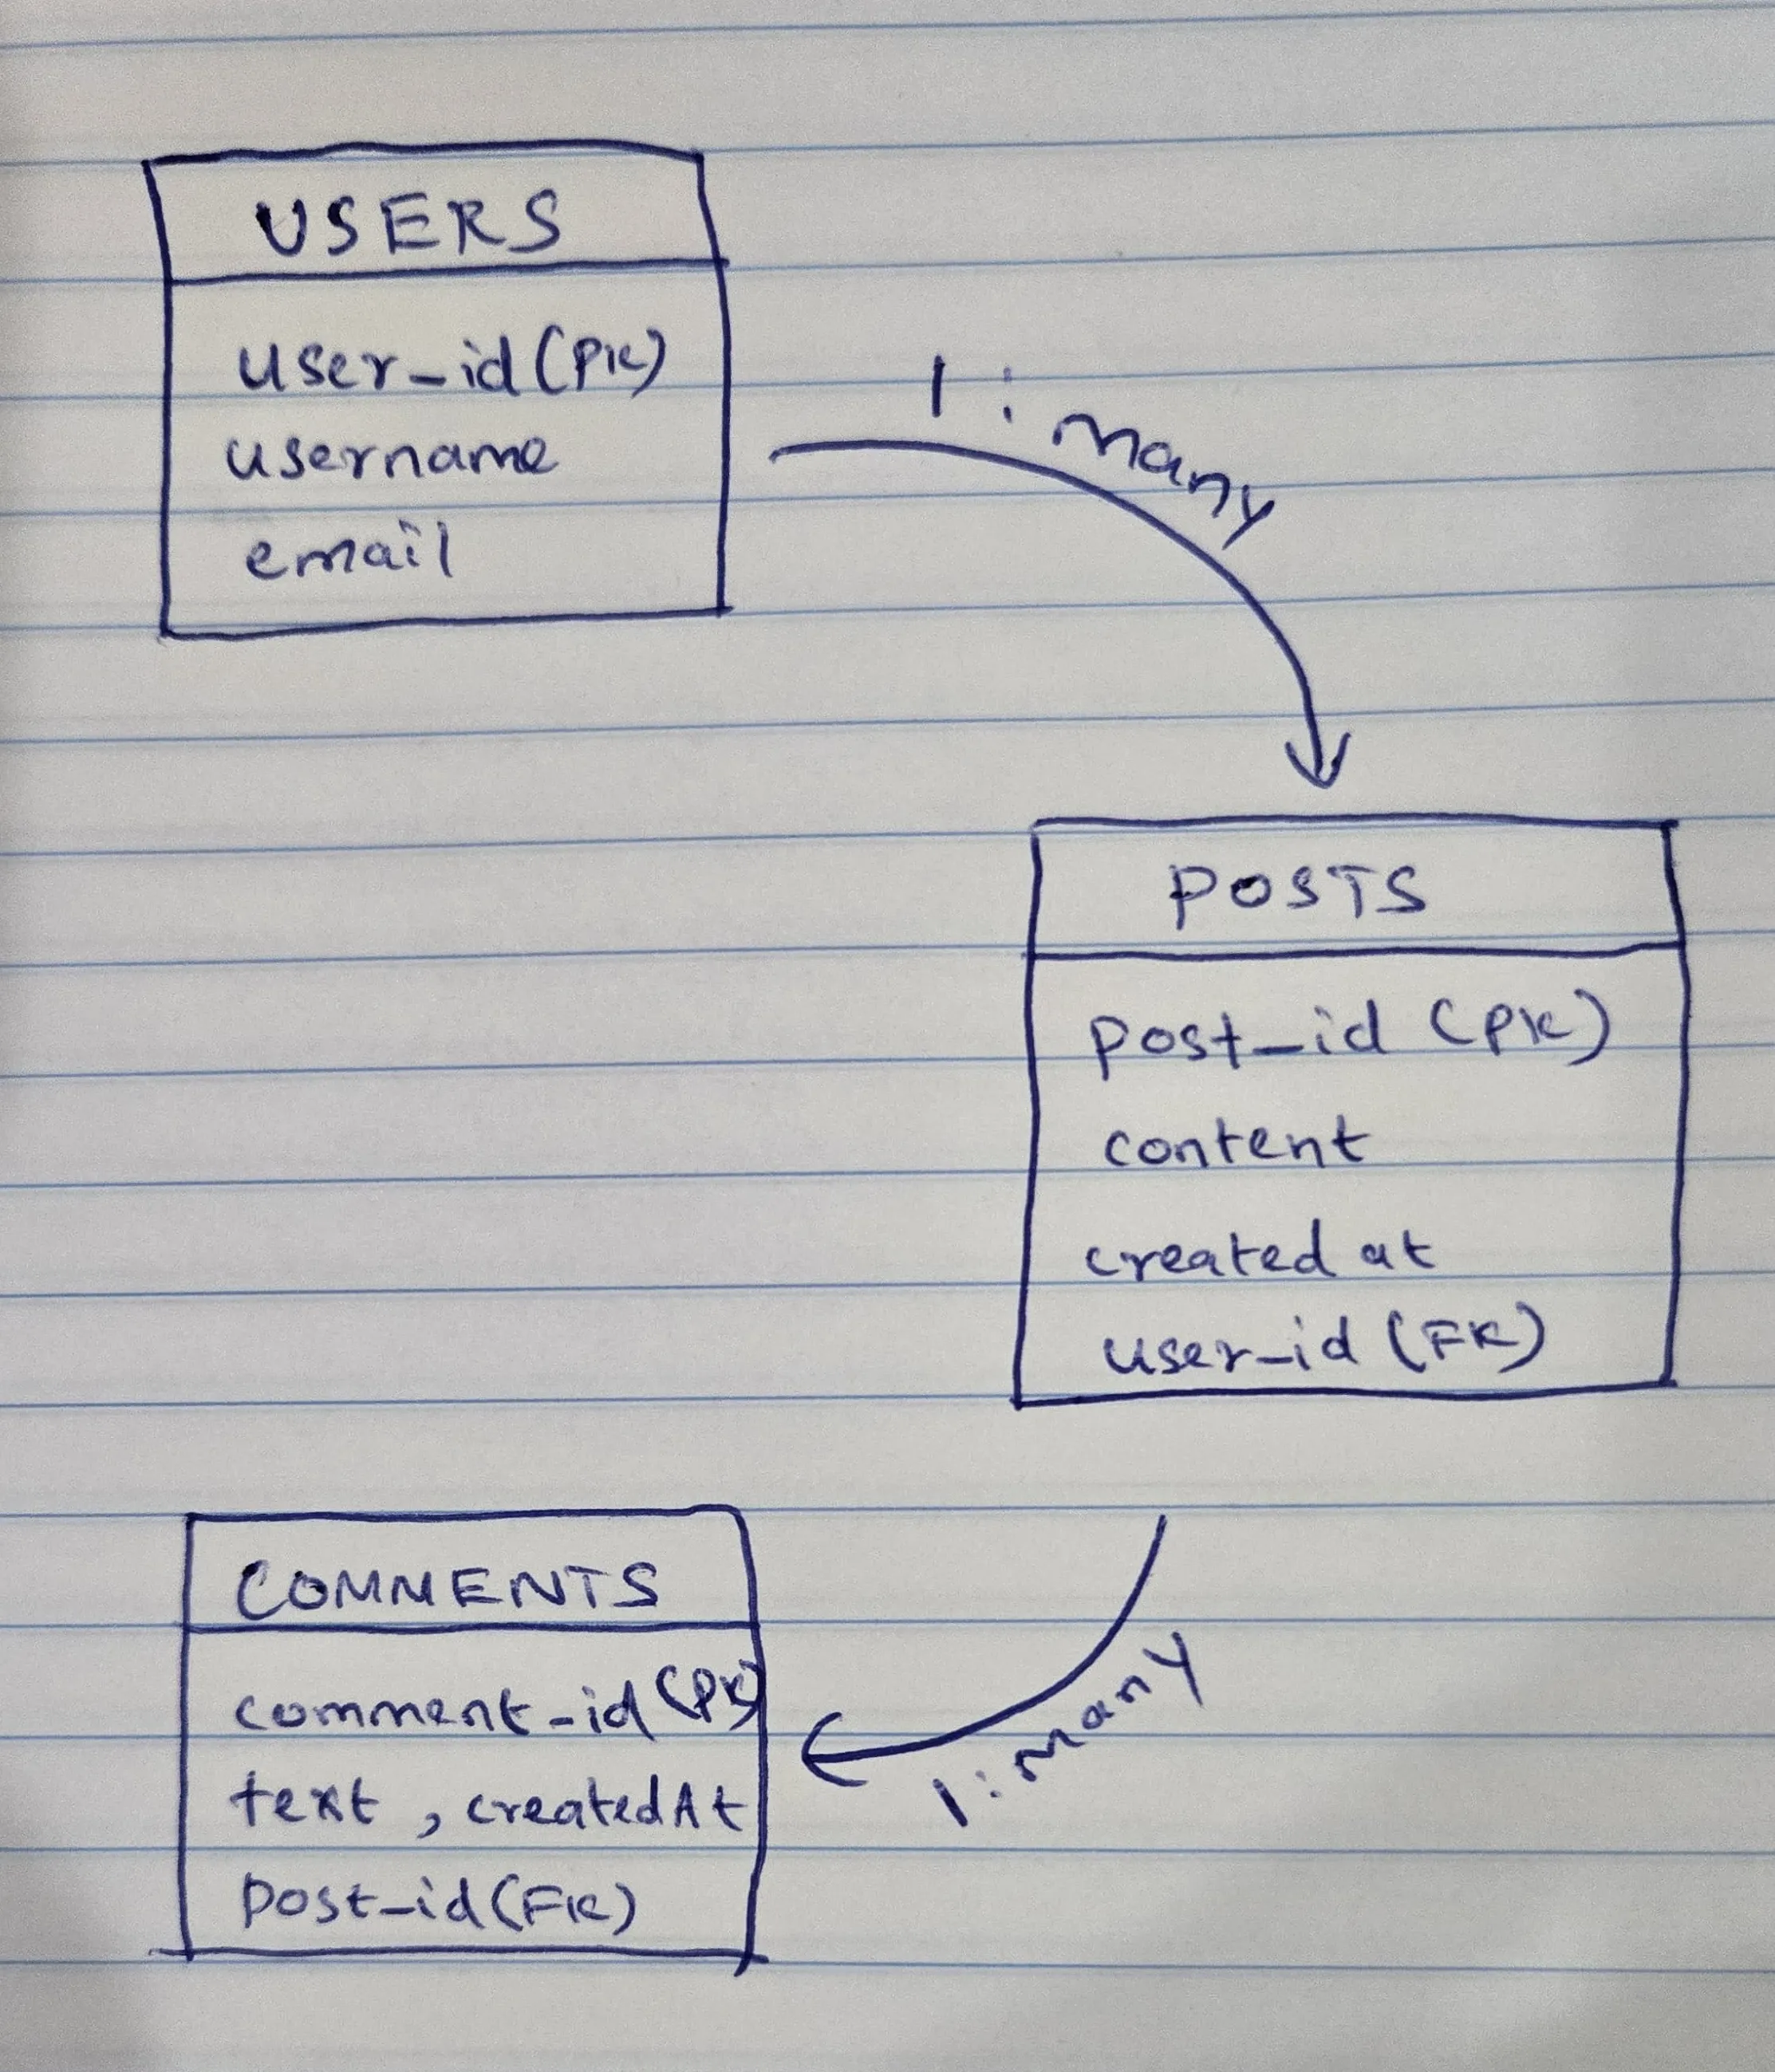
Despite messy handwriting, after uploading such sketches, the tool generates a proper ER diagram with relationships clearly defined:
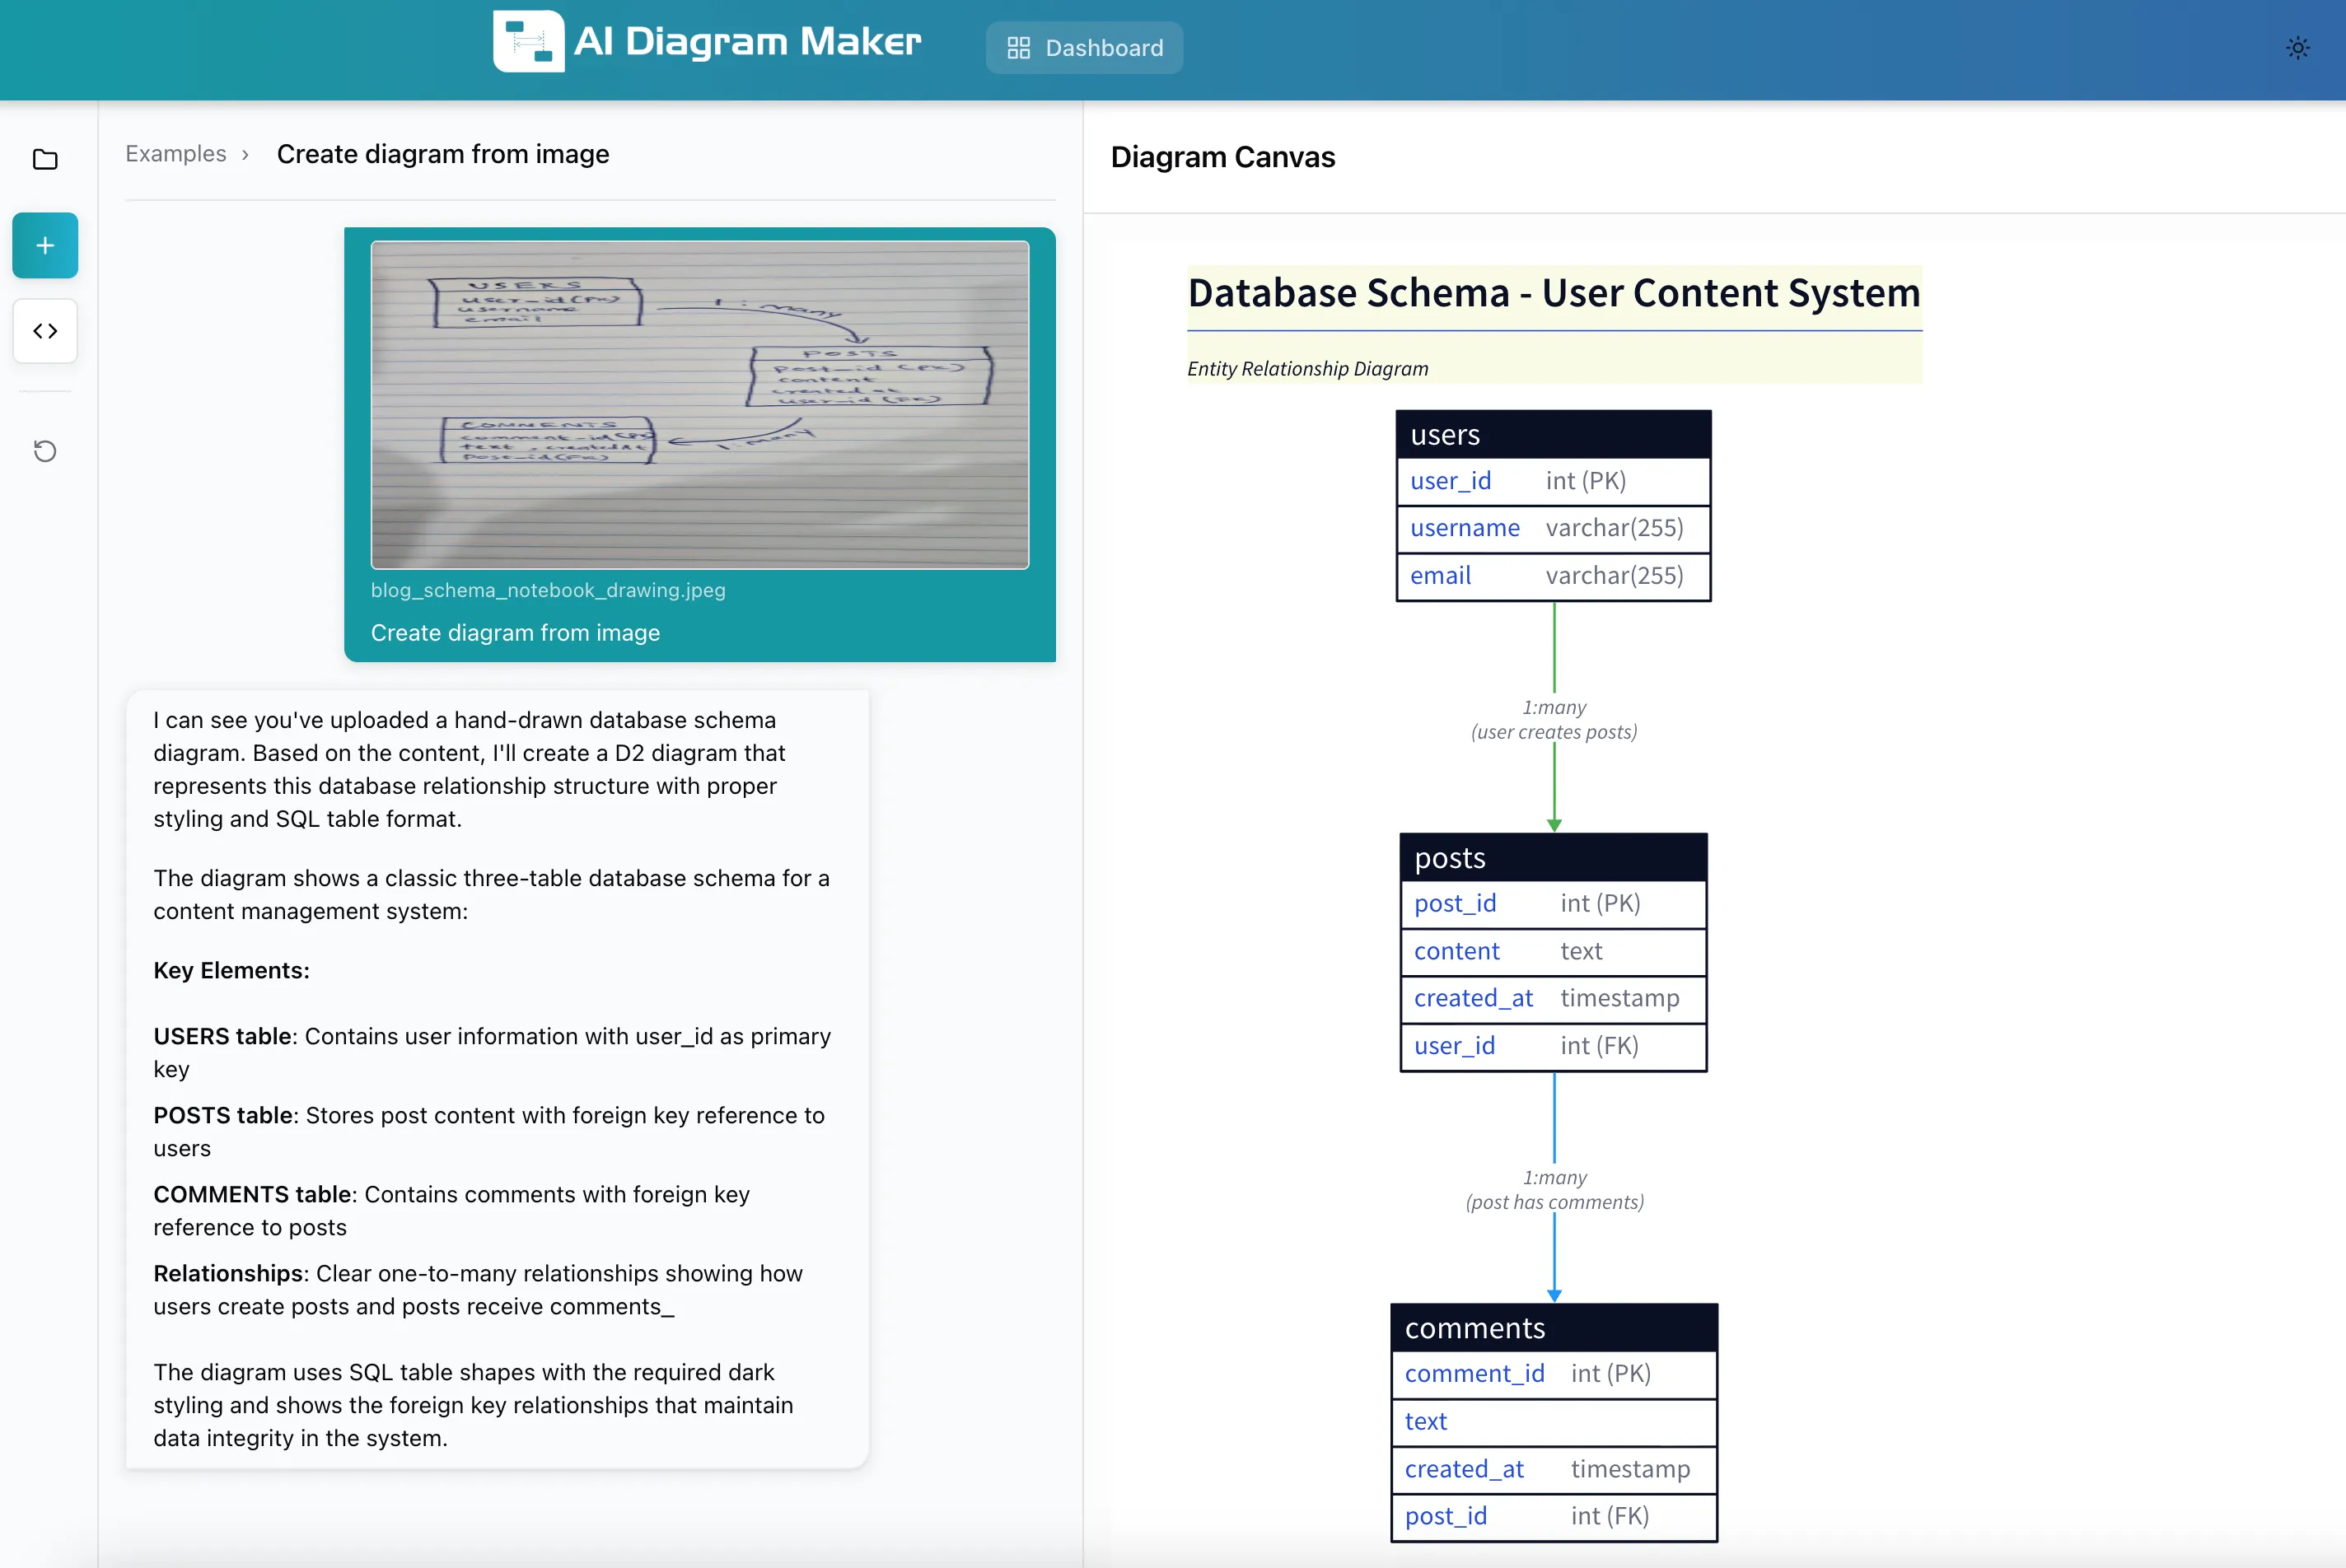
The generated diagram captures the one-to-many relationships correctly, making it easy to iterate by adding indexes, constraints, and additional fields.
Beyond Initial Conversion
The real value isn’t just digitization—it’s what you can do afterward. Once you have a digital version:
- Version control: Store diagrams as code in your repo
- Collaborative editing: Share with team members for feedback
- Easy updates: Modify diagrams as requirements evolve
- Documentation integration: Embed in Confluence, Notion, or markdown docs
- Multiple formats: Export to PNG, SVG, or diagram-as-code formats
AIDiagramMaker lets you refine diagrams with natural language commands like “add a caching layer between the API and database” or “show the error handling flow,” which speeds up iteration significantly.
Alternative Tools Worth Checking Out
While this guide focuses on AIDiagramMaker for examples, here are other tools worth exploring:
- Eraser.io: Great for technical diagrams with AI assistance
- PlantUML/Mermaid: Diagram-as-code (no image conversion, but great for version control)
Final Thoughts
Converting whiteboard sketches to digital diagrams used to be a necessary evil. With AI-powered tools, it’s become a quick, almost automatic step in the design process.
The key is finding a workflow that fits your team’s needs. An effective approach typically includes:
- Sketching freely during discussions without worrying about cleanup
- Quickly digitizing within an hour while context is fresh
- Iterating and refining the digital version as requirements evolve
- Storing the final version in the documentation system
This approach can save hours each week and, more importantly, reduces the friction between ideation and documentation. When it’s easy to capture and refine ideas, teams are more likely to actually document them.
For teams still manually redrawing diagrams, trying one of these AI-powered approaches is worth considering. Even if it only saves 20 minutes per diagram, that adds up quickly over a sprint or project.