· Glossary · 3 min read
What Is Latency?
Latency is the time interval between a stimulation and a response in software, often measured in milliseconds, and is a critical factor in user experience and system performance.
You click a button. You wait. The spinner spins. You get frustrated. That wait time is Latency.
Simple Definition of Latency
Latency is the time interval between a stimulation and a response. In software engineering, it is the delay between a user’s action and the application’s reaction. It is often measured in milliseconds (ms). If you ping a server and it takes 50ms to reply, that is the “Network Latency.” If the database takes 200ms to find the record, that is “Processing Latency.” The user experiences the sum of all these delays.
The Time Delay Between Request and Response
Think of it like ordering a pizza.
- Network Latency: The time it takes for you to call the pizza place.
- Processing Latency: The time it takes for them to bake the pizza.
- Network Latency (Return): The time it takes for the driver to deliver it. In a distributed system, a single user request might trigger fifty internal “pizza orders” between microservices. If any one of them is slow, the user waits.
Why Latency Matters
Latency is the silent killer of user engagement.
User Experience and SEO
Amazon famously found that every 100ms of latency cost them 1% in sales. Google includes “Core Web Vitals” in their ranking algorithm, meaning slow sites get ranked lower. High latency makes an app feel sluggish and broken. Low latency makes it feel snappy and premium. For backend developers, managing latency is about optimizing code, queries, and network paths. It is about moving data closer to the user using CDNs or caching frequently accessed data in Redis.
Visualizing Latency
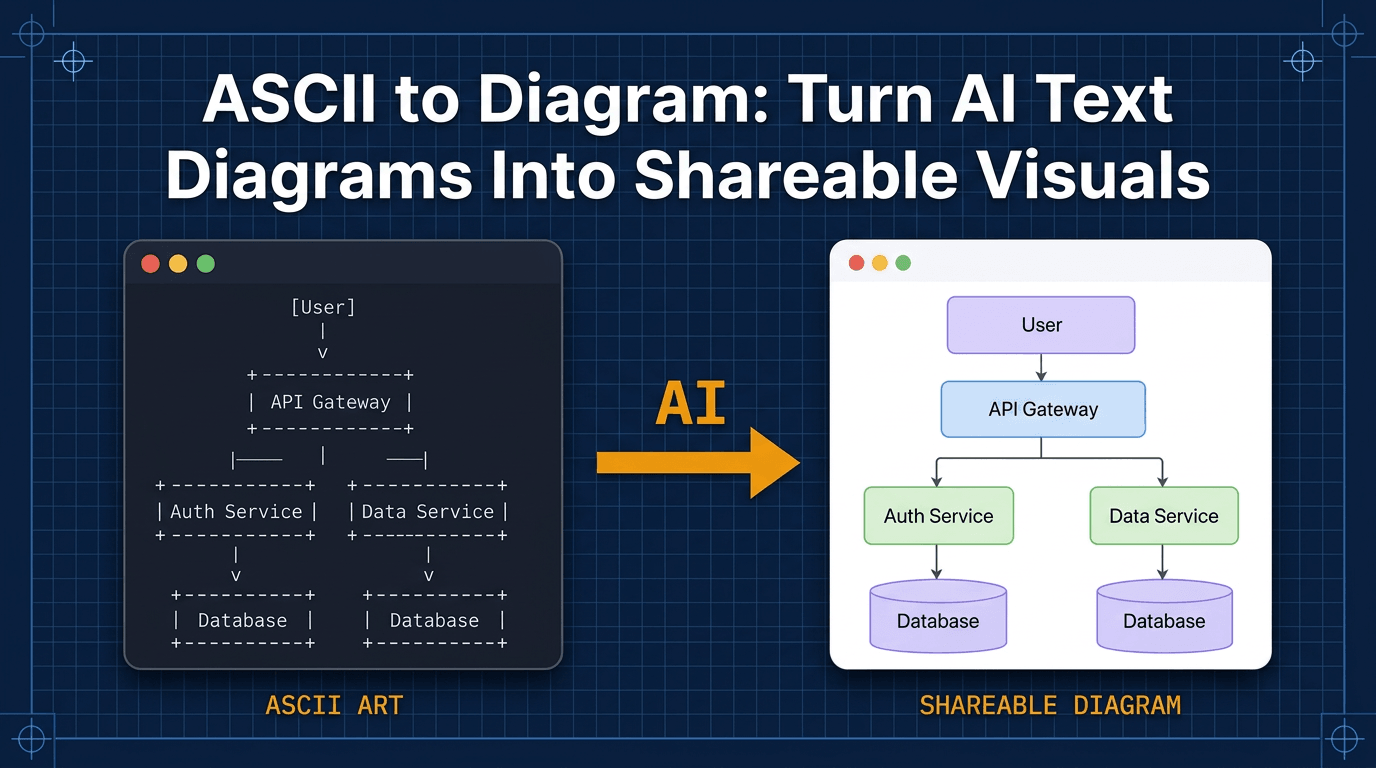
Latency is invisible in code but highly visible in diagrams.
Showing delays on Sequence Diagrams (vertical space)
A sequence diagram is the best way to visualize latency. In these diagrams, time flows downwards. If a request is fast, the return arrow is drawn immediately below the request arrow. The “Activation Bar” (the rectangle on the lifeline) is short. If a request is slow (high latency), the return arrow is drawn much lower down the page. The Activation Bar is long and tall. This visual gap creates a visceral understanding of the delay. You look at the diagram and see a huge empty space on the “Database” lifeline. You instantly know that the DB is the bottleneck.
Related Terms
To talk about performance, you need these terms.
- Throughput: How much data can pass through a system in a given time. You can have high throughput (lots of data) but high latency (it takes a while to arrive).
- Bandwidth: The maximum capacity of the network link.
- Response Time: The total time from the user’s perspective. It includes network latency plus processing time.
- Synchronous Communication: A communication pattern where the client waits for the server to respond, adding to the perceived latency. Read more about Synchronous Communication.
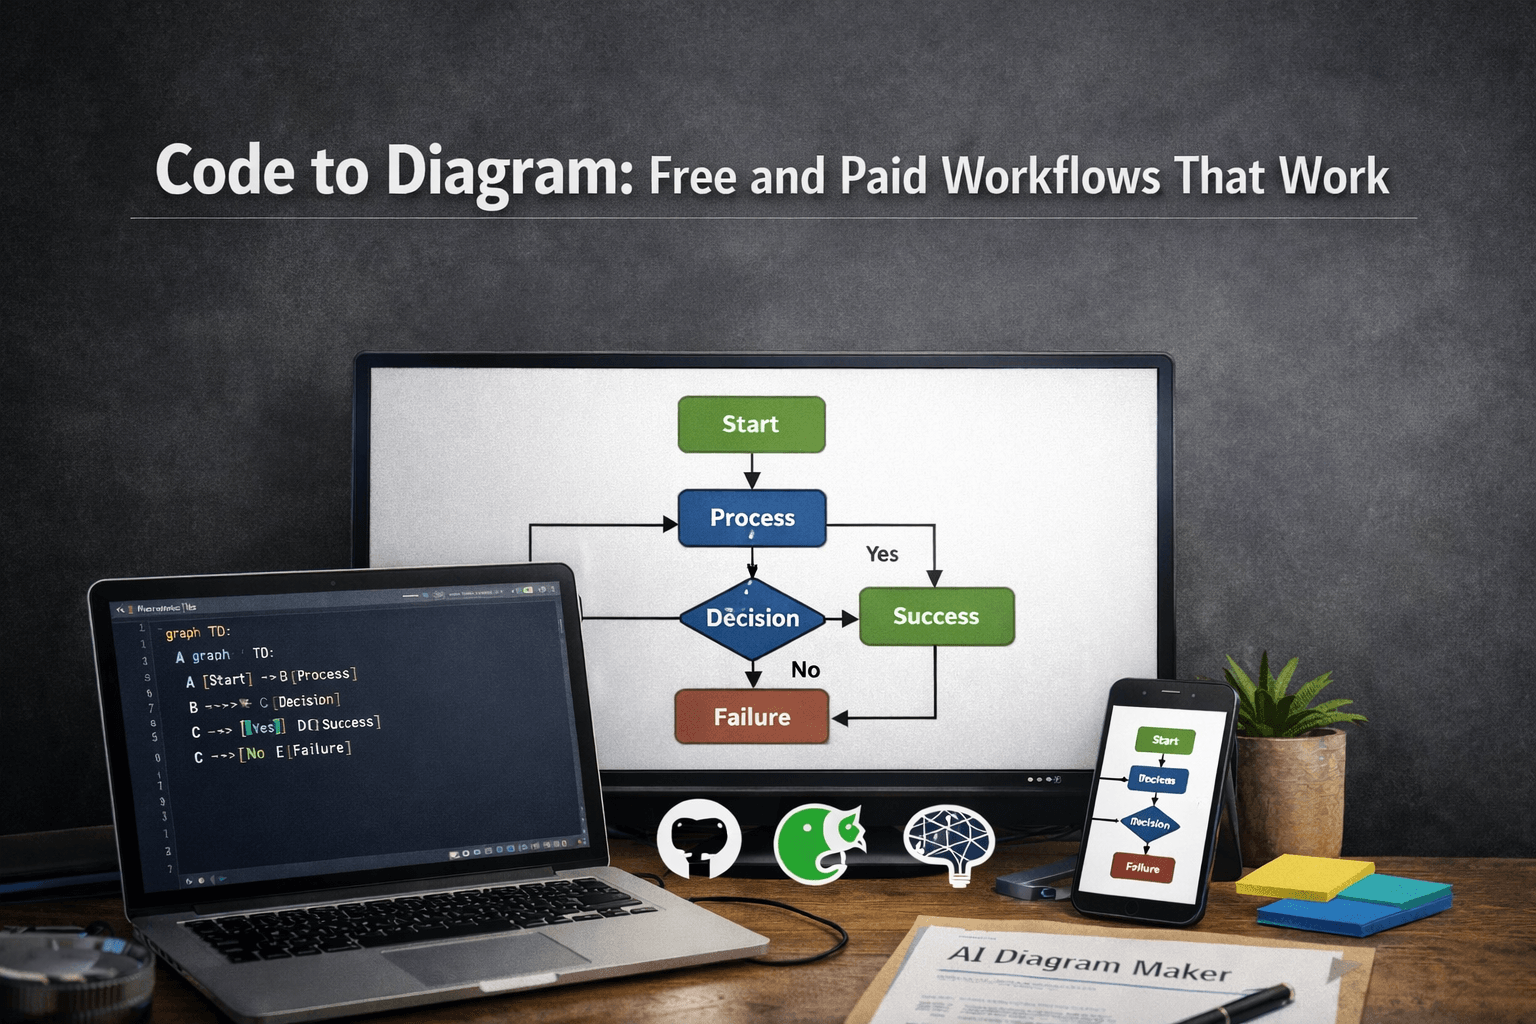
For more on visualizing system performance, check out our Developer’s Guide: The Programmable Diagram: A Developer’s Guide to D2 and Text-Based Visuals.