· Glossary · 4 min read
What Is a Lifeline (in Sequence Diagrams)?
A lifeline is the visual element that represents time and the existence of an object in a sequence diagram. Learn how it organizes messages chronologically in software architecture.
Most diagrams show relationships in space. A map shows that the library is next to the bank. But in software engineering, we also need to map relationships in time. A Lifeline is the visual element that represents time in a Sequence Diagram.
Simple Definition of a Lifeline
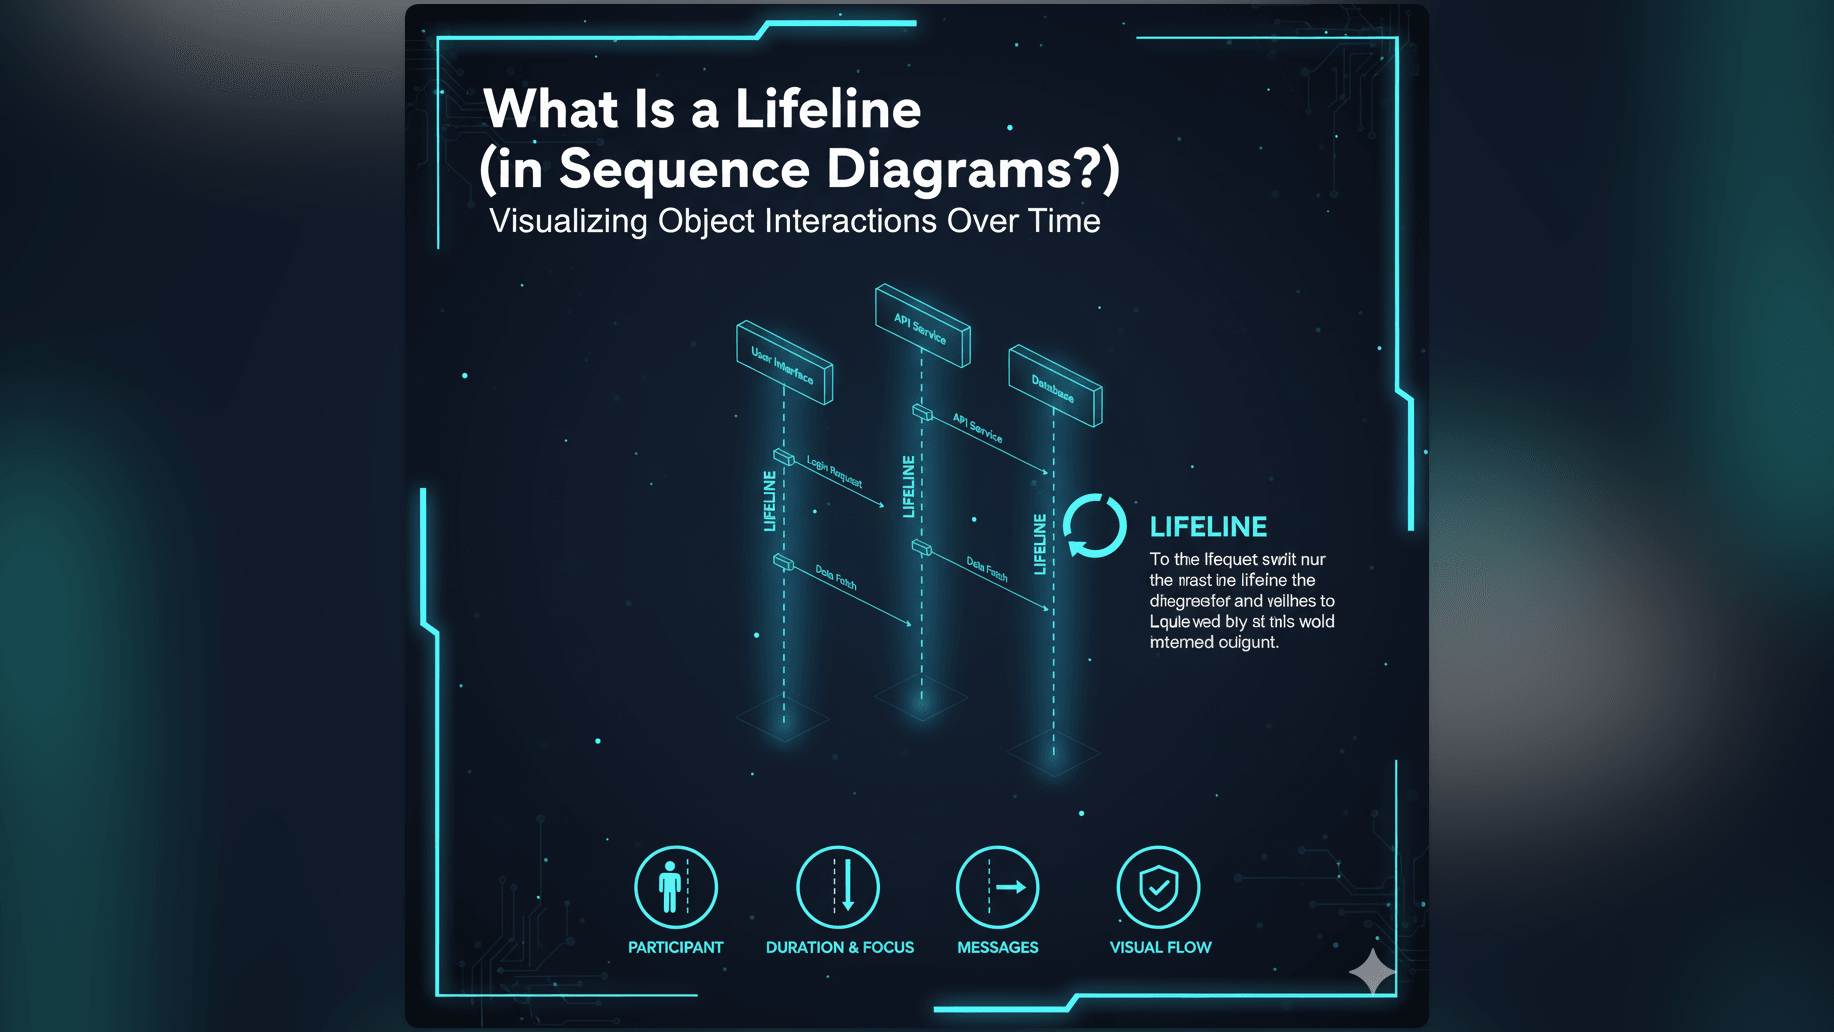
A Lifeline is a vertical dashed line in a Unified Modeling Language (UML) sequence diagram. It represents the existence of an object or participant over a period of time.
At the very top of the line, there is usually a rectangle or a stick figure. This is the “Head” of the lifeline and it names the object being represented, such as “User” or “Database.”
The dashed line extends downward from the head. The further down you go on the line, the later in time you are.
Representing an Object’s Existence and Participation in an Interaction
The lifeline tells you that a specific component exists and is available to interact. If the lifeline stops halfway down the page, it means that object has been destroyed or is no longer part of the process.
It acts as a “lane” for that object. Any message sent to that object points to its lifeline. Any message sent from that object originates from its lifeline.
Why Lifelines are Fundamental to Sequence Diagrams
Without lifelines, a Sequence Diagram would just be a jumble of arrows. The vertical lines provide the grid structure that makes the diagram readable.
Tracing the Flow of Messages Over Time
The primary job of the lifeline is to order events chronologically.
If Message A hits the lifeline near the top and Message B hits the lifeline near the bottom, we know for a fact that Message A happened first. This chronological ordering is critical for debugging complex systems where the order of operations matters.
Showing the Active Duration of an Object or Participant
You will often see a thin rectangular box superimposed on top of the dashed lifeline. This is called an Activation Bar.
While the lifeline shows that the object exists, the activation bar shows that the object is active. It means the object is currently processing a task or waiting for a return value. It adds a layer of depth to the diagram by showing exactly when a server is busy versus when it is idle.
Real-World Example: Lifeline of a User and a System
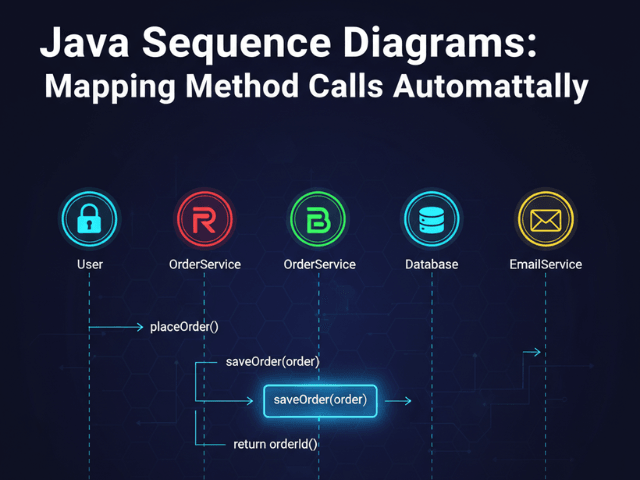
Imagine a diagram showing a person checking their email. You would see two lifelines:
- User Lifeline: Represents the person.
- EmailServer Lifeline: Represents the backend system.
Visualizing Interaction Over Time
At the top of the diagram, an arrow goes from the User lifeline to the EmailServer lifeline labeled “Click Refresh.”
A moment later (further down the line), an arrow goes from EmailServer back to User labeled “Show New Emails.” The vertical distance between these two arrows on the lifeline represents the latency or the processing time. It visualizes the wait.
How AI Diagram Maker Handles Lifelines in Sequence Diagrams
Drawing these lines manually is tedious. You have to ensure they are all exactly the same length and perfectly vertical. If you need to add a new actor in the middle, you have to shift all the other lifelines to the right.
Automatically Creating and Arranging Lifelines from Text Descriptions
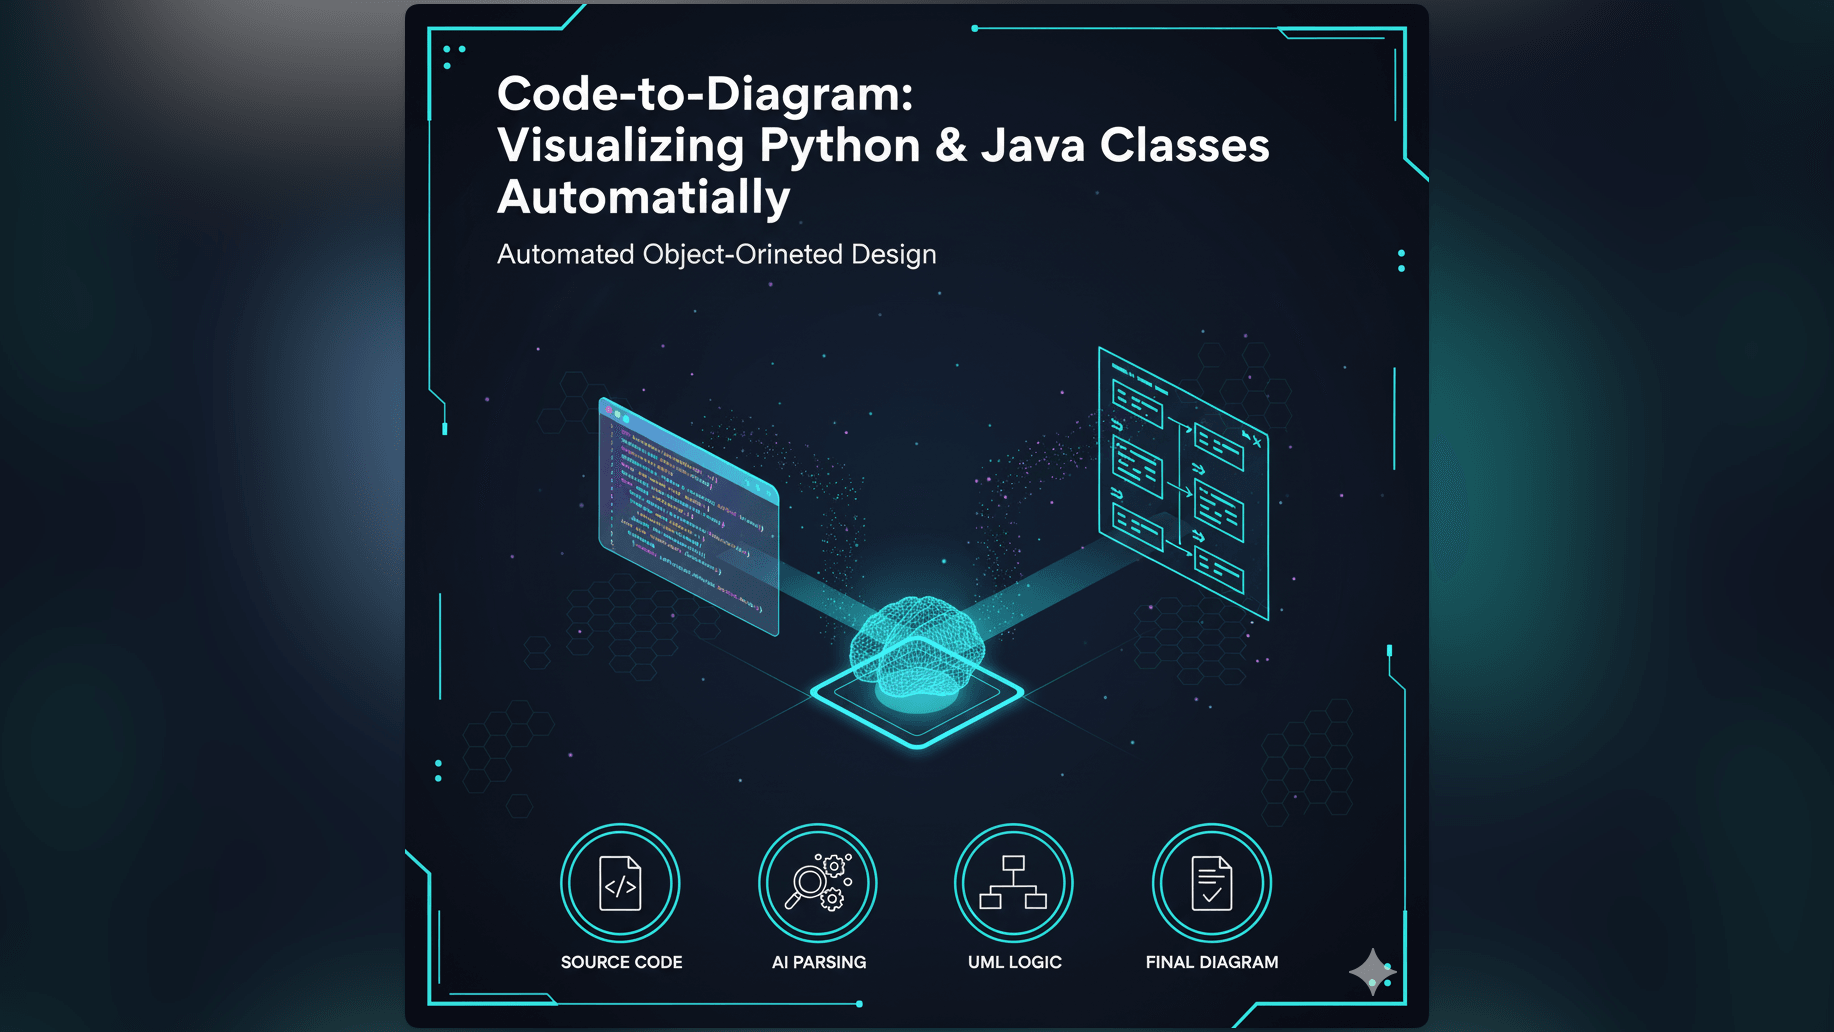
With our AI Sequence Diagram Generator, you don’t draw lines: you describe the story.
You type: “User calls Server. Server calls Database.”
The AI identifies “User” and “Server” and “Database” as the participants. It automatically draws three parallel lifelines for them. It handles the spacing. It draws the arrows connecting them at the correct vertical positions.
If you later decide to add a “Cache” between the Server and Database, the AI automatically shifts the lifelines to make room. It handles the geometry so you can focus on the logic.
Related Terms
To understand sequence diagrams fully, you should know these related terms:
- Sequence Diagram: A type of interaction diagram that shows how objects operate with one another and in what order.
- Actor: A user or external system that interacts with the main system. It usually has its own lifeline.
- Message: A communication between two lifelines, usually represented by a horizontal arrow.
- Activation Bar: The thin rectangle on a lifeline indicating that an object is currently performing an operation.
- UML (Unified Modeling Language): The standard visual language for system design.
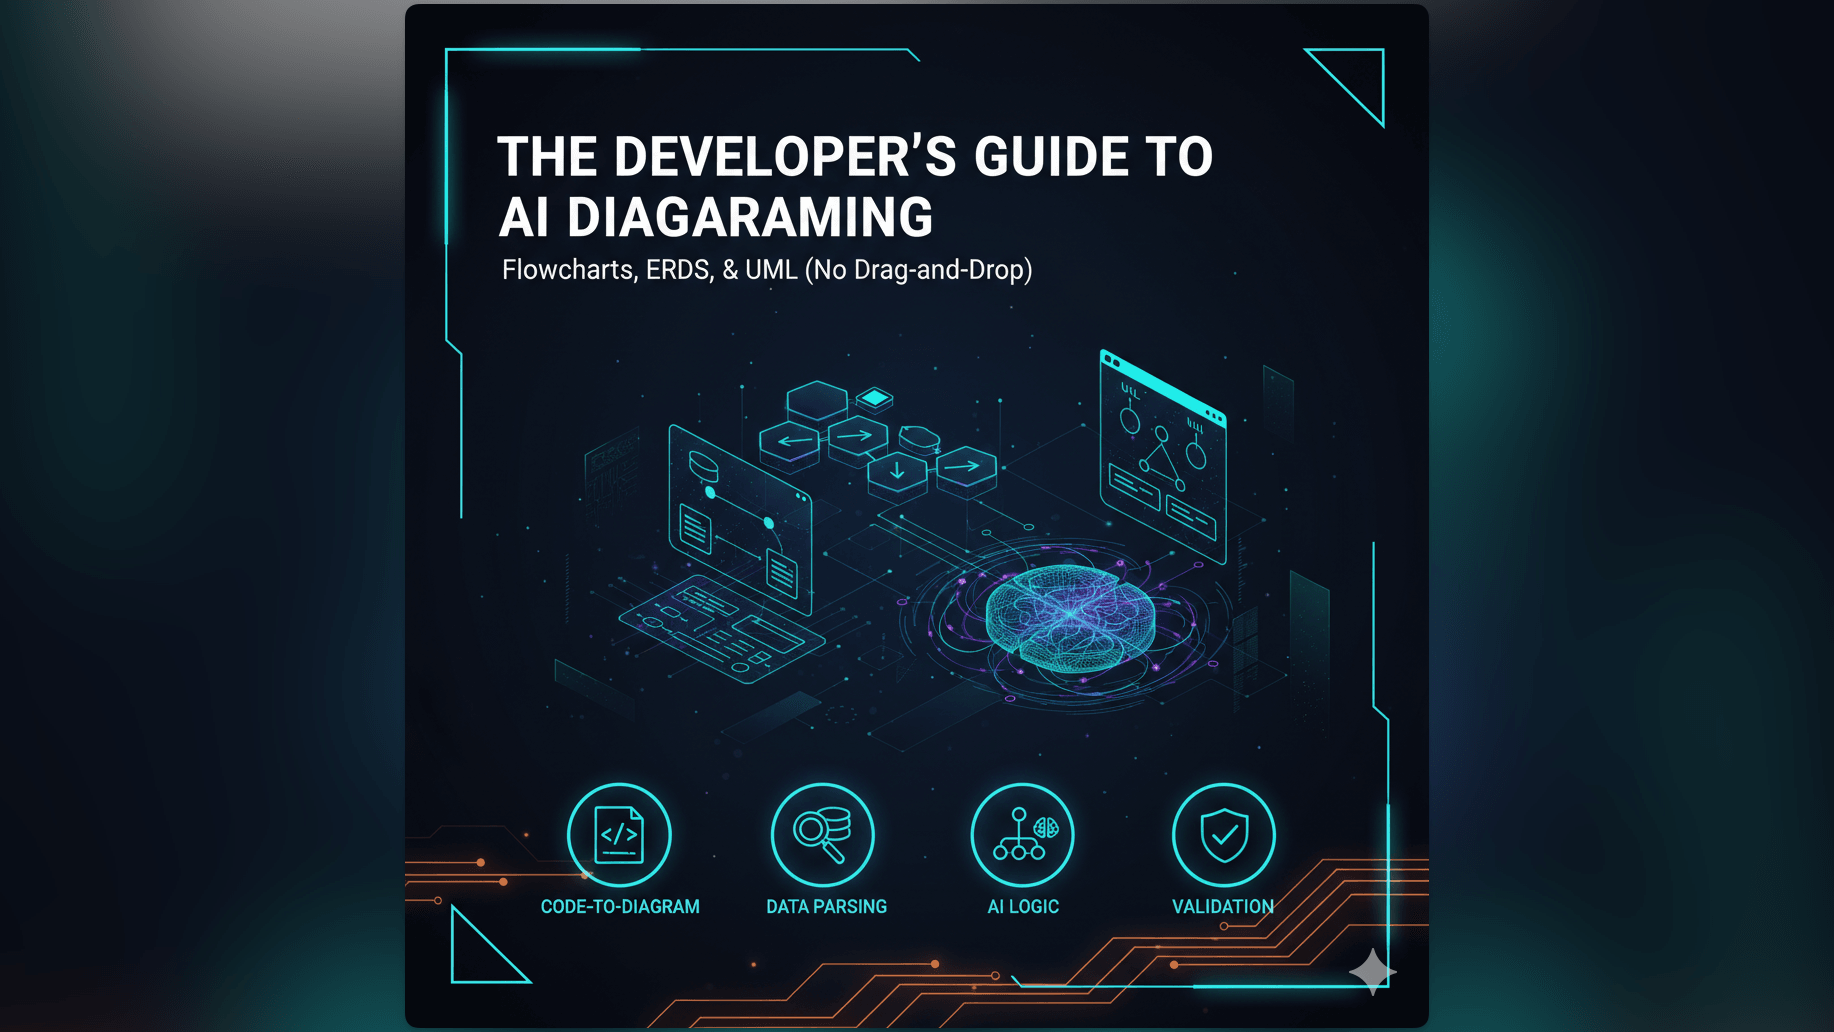
For more details on generating these time-based diagrams automatically, check out our Developer’s Guide to AI Diagramming.