· Developer Tools · 12 min read
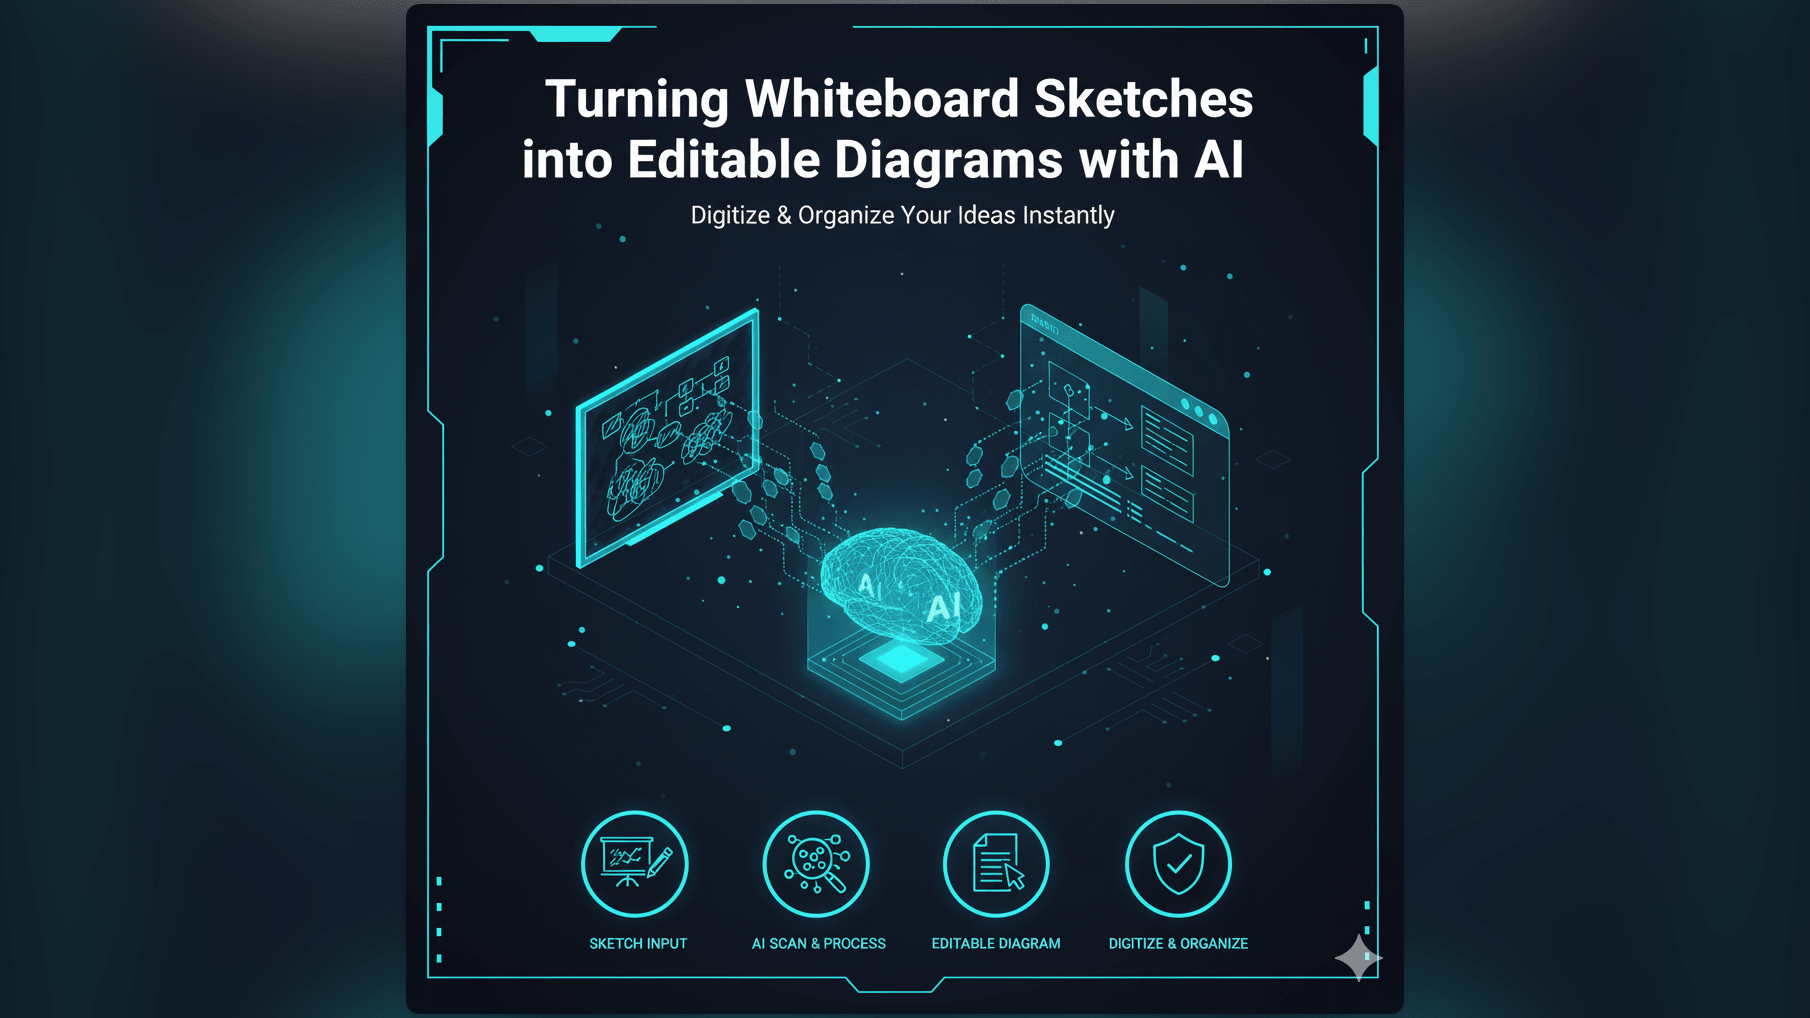
Turning Whiteboard Sketches into Editable Diagrams with AI
Stop letting great ideas die in Slack photos. Learn how image to flowchart AI technology transforms messy whiteboard sketches and hand-drawn notes into fully editable, professional digital diagrams instantly.
There is a specific energy in a room when a team is solving a hard problem. You are standing at the whiteboard. You have a marker in one hand and an eraser in the other. You are drawing boxes and furious arrows. You are mapping out the new microservices architecture or maybe figuring out a complex user journey that has been blocking the frontend team for weeks.
Everyone is nodding. The solution is finally clear. It is right there on the board in red and blue ink.
Then the meeting ends.
Someone says “Great session everyone” and walks out. You are left staring at the whiteboard. You know exactly what happens next. You pull out your phone. You take a photo. You post it in the Slack channel with a caption like “Notes from today’s architecture sync.”
And that is where the idea goes to die.
A photo of a whiteboard is where knowledge gets trapped. You cannot edit a photo. You cannot search the text inside it. If you want to change one box in that architecture you have to redraw the entire thing from scratch in a digital tool. It is the classic gap between analog creativity and digital documentation.
This guide explores how we are closing that gap. We are going to talk about image to flowchart ai technology and how you can take that messy photo of a whiteboard and turn it into a fully editable professional diagram in seconds.
The Challenge: Bridging the Gap Between Analog Brainstorming and Digital Documentation
We love whiteboards. There is something about the physical act of drawing that unlocks creativity in a way that dragging a mouse never will. When you are brainstorming, speed is everything. You scrawl. You abbreviate. You draw crooked lines because the idea is more important than the aesthetic.
The Value of Whiteboard Sessions and Hand-Drawn Diagrams
The value of these sessions is immense. This is where the real engineering work happens. It is where the “High Level Design” is actually born.
But the artifact produced - the drawing itself - is incredibly low value in its physical form. It is static. It reflects a moment in time. As soon as you erase the board, that diagram is gone forever unless someone took that photo.
The Pain Point of Recreating Sketches Manually in Digital Tools
So usually one poor soul gets assigned the task of “digitizing” the board. Maybe it is the junior dev. Maybe it is the tech lead who cares too much about documentation.
They sit down at their desk. They open a diagramming tool. They put the photo of the whiteboard on one monitor and the blank canvas on the other. Then they spend the next hour playing a game of spot the difference.
“Okay so this box connects to the User Service. Wait is that an arrow or just a stray mark? What does that word say? Is that ‘Queue’ or ‘Query’?”
It is tedious work. It is essentially data entry. And because it is boring, people procrastinate on it. The digital diagram doesn’t get made until three days later. By then the team has already started coding based on their memory of the meeting. This creates a disconnect. The code does one thing. The documentation, which arrives late, says another.
The Disconnect Between Quick Ideas and Formal Documentation
This friction causes a lot of teams to just give up on formal documentation. They rely on the “tribal knowledge” stored in that Slack photo.
But what happens when a new engineer joins the team six months later? They ask how the system works. You send them a link to a grainy photo from last February. They can’t read it. They can’t update it. The knowledge is locked away.
We built the image to flowchart ai feature in AI Diagram Maker to stop this cycle. We wanted to make the transition from “idea on a wall” to “diagram in a repo” instantaneous.
Introducing AI Diagram Maker: Your Image to Flowchart AI Solution
The concept is simple but the technology behind it is powerful. You upload an image. We give you a diagram.
But it is not just taking a scan. If you scan a document, you just get a digital picture of the text. You still can’t move the words around. Our AI doesn’t just “see” the image. It understands it.
How Whiteboard to Diagram AI Works: From Photo to Structured Diagram
When you upload a sketch to AI Diagram Maker, our engine performs a multi-step analysis.
First, it uses computer vision to identify the components. It separates the background noise (the dirty whiteboard smudges) from the actual content.
Next, it performs Optical Character Recognition or OCR to read your handwriting. It is surprisingly good at deciphering developer scrawl. It figures out that “Auth” inside a box means an authentication service.
Finally, and this is the magic part, it understands the topology. It sees that there is a line connecting Box A to Box B. It recognizes that the diamond shape implies a decision point. It constructs a logical model of your drawing.
It then translates that model into our digital format. The result isn’t a static image. It is a live editable diagram. You can click on the box that used to be a scribble and type new text. You can drag it to a new location and the arrows follow it.
The Magic of AI: Recognizing Shapes, Text, and Connections
You might be wondering how precise you need to be. Do you need to be an artist?
No. In fact, the AI is trained on the messy reality of engineering diagrams. It recognizes that a roughly drawn circle is meant to be a Start/End node. It understands that three stacked cylinders usually represent a database. It gets that a line with an arrow at the end is a directional flow.
You just draw as you normally would. The AI interprets your intent. It acts like a smart translator turning “Human Sketch” into “System Diagram.”
The Goal: Instant Digitalization, Not Just a Scanned Image
The ultimate goal here is velocity. We want to reduce the time from “Idea” to “Documentation” to near zero.
If you can digitize the whiteboard before you even leave the meeting room, you have won. You can project the digital version on the screen in the last five minutes of the meeting. You can ask “Did the AI get this right?” The team can verify it right there.
You leave the room not just with a photo, but with a committed file in your GitHub repository.
Real-World Scenarios for Converting Images to Diagrams
We see our users leveraging this in ways we didn’t initially expect. It turns out that sketch to diagram is useful in a lot of different contexts.
Digitizing Brainstorming Sessions for Project Documentation
This is the classic use case. A team maps out a new feature - AI Use Case Diagram Generator specifically a new system architecture. They cover the board in boxes representing the load balancer the web servers and the database cluster.
Instead of transcribing it later, the Tech Lead snaps a picture. They upload it to AI Diagram Maker. Within seconds they have a clean System Architecture Diagram. They might use the chat feature to refine it slightly: “Change the database icon to red”: but 90% of the work is done. They export it and add it to the Design Doc immediately.
Converting Hand-Drawn Flowcharts into Editable Formats
Product Managers love this one. Often a PM will sketch out a user flow in a notebook during a coffee break. “User logs in -> sees promo -> clicks buy -> success.”
It is a rough sketch. But logic is there. They take a photo of their notebook page. The ai flowchart maker converts it. Now they have a professional looking flowchart they can show to the designers and developers. They didn’t have to fiddle with alignment tools. They just sketched and uploaded.
Transforming Legacy Scans into Modern System Architecture Diagrams
We had a user recently who was migrating a legacy mainframe system. The only documentation they had was a set of old printouts from the 1990s. They were scanned PDFs of diagrams drawn decades ago.
They took screenshots of these old PDFs and fed them into the tool. The AI reconstructed the logic. Suddenly they had a modern editable version of a 30-year-old system diagram. They could then start refactoring the diagram to reflect the new cloud-based architecture they were building. It was like archaeological restoration but for code.
Sharing Ideas from Physical Meetings with Remote Teams
Hybrid work is hard. If half the team is in the office and half is on Zoom, the remote folks often feel left out of the whiteboard session.
With this tool you can bridge that gap. You draw on the board. You snap a picture. You convert it. You share the link to the digital diagram in the Zoom chat. Now the remote team isn’t just looking at a blurry video feed of a whiteboard. They are looking at a crisp digital diagram. They can even suggest edits. “Hey I think that arrow should point to the cache not the DB.” It makes the meeting inclusive and effective.
The Workflow: From Sketch Capture to Editable Diagram
Using this feature is incredibly straightforward. We designed it to be used on the go, often from a mobile device or a laptop immediately after a meeting.
Step-1: Capturing Your Sketch (Photo or Screenshot)
Take a photo of your whiteboard. Or if you drew something on a tablet or a piece of paper, take a screenshot or photo of that.
Try to get a clear shot. While the AI is good at filtering noise, getting a straight-on angle helps. Ensure the text is somewhat legible. If a human can’t read your handwriting, the AI probably struggles too. But you would be surprised how much it can read.
Step-2: Uploading to AI Diagram Maker
Open AI Diagram Maker. Select the “Import from Image” option. Drag and drop your file. We support the standard formats like PNG and JPG.
Step-3: AI Processing and Initial Diagram Generation
This is where the heavy lifting happens. You will see a loading state for a few seconds. The engine is analyzing the pixel data, identifying the nodes, and tracing the paths.
It maps these to our internal diagramming components. A drawn rectangle becomes a “Process Node.” A drawn cylinder becomes a “Database Node.”
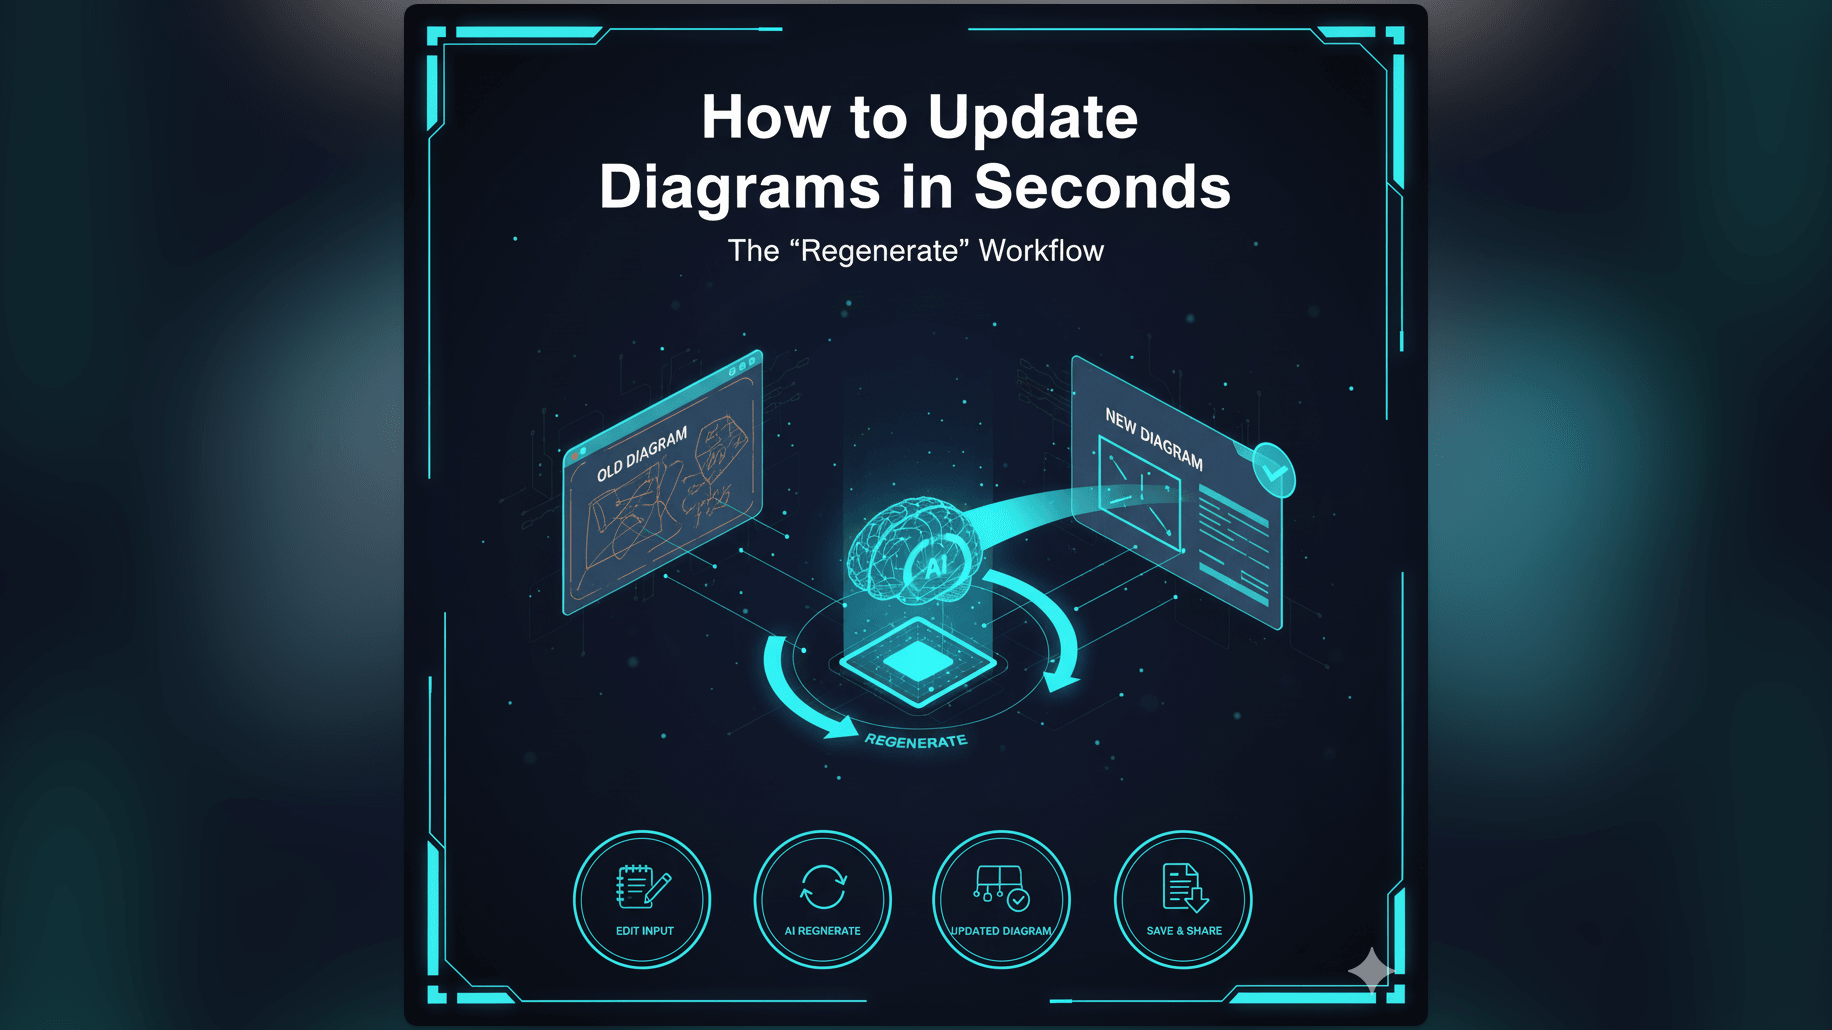
Step-4: Reviewing, Refining, and Exporting Your Digital Diagram
The diagram appears on your screen. It will look like a cleaned up vectorized version of your drawing.
Now you can refine it. This is where our tool shines compared to static OCR. You can use the chat interface.
- “The text in the second box should say ‘Authorization’ not ‘Authors’.”
- “Change the layout to be vertical instead of horizontal.”
- “Group the bottom three nodes into a cluster called ‘Backend Services’.”
Once you are happy, you export it. You can send it to your team or push it to GitHub. You have gone from analog mess to digital asset in under five minutes.
Why Tech Leads Love Image to Diagram AI
If you are a Tech Lead or a Staff Engineer, your time is your most scarce resource. You are constantly shifting context between coding, reviewing PRs, and designing architecture.
Rapid Prototyping and Documentation from Physical Meetings
You don’t have time to be a drafter. You want to be an architect. This tool allows you to stay in the architect role. You define the structure on the whiteboard. The tool handles the drafting. It allows you to prototype rapidly. You can draw three different versions of a system on a whiteboard, erase and redraw, and digitize each one to compare them later.
Reducing Manual Effort and Error in Redrawing
There is also a reduction in error. When you manually redraw a diagram you might accidentally skip a connection. You might misread a label. The AI tries to capture exactly what is there. And because it is fast, you are more likely to double-check it right then and there while the memory is fresh.
Streamlining the Transition from Idea to Implementation
Ultimately this feature is about momentum. It keeps the momentum of the project moving forward. You don’t lose days waiting for documentation. You don’t have the “I’ll do it later” bottleneck.
You turn the idea into implementation details immediately. For The Developer’s Guide to AI Diagramming or broader system designs, it removes the friction.
Frequently Asked Questions About Whiteboard to Diagram AI Conversion
What image formats are supported for conversion? We currently support common image formats like JPG, PNG, and WebP. You can upload photos directly from your phone or screenshots from your computer.
How accurate is the AI in recognizing elements from a sketch? It is surprisingly high. We trained the model on thousands of examples of engineering diagrams. It recognizes standard shapes like rectangles, circles, diamonds, and cylinders. It is robust against messy lines and varied handwriting. However, it works best if there is some contrast between the marker and the board.
Can I edit the generated diagram after conversion? Yes absolutely. This is the main point. We don’t just give you a “cleaned up image.” We give you a fully structured diagram. You can click on any text to change it. You can delete nodes. You can reroute arrows. You can use our chat assistant to make bulk changes like “Make all database nodes blue.”
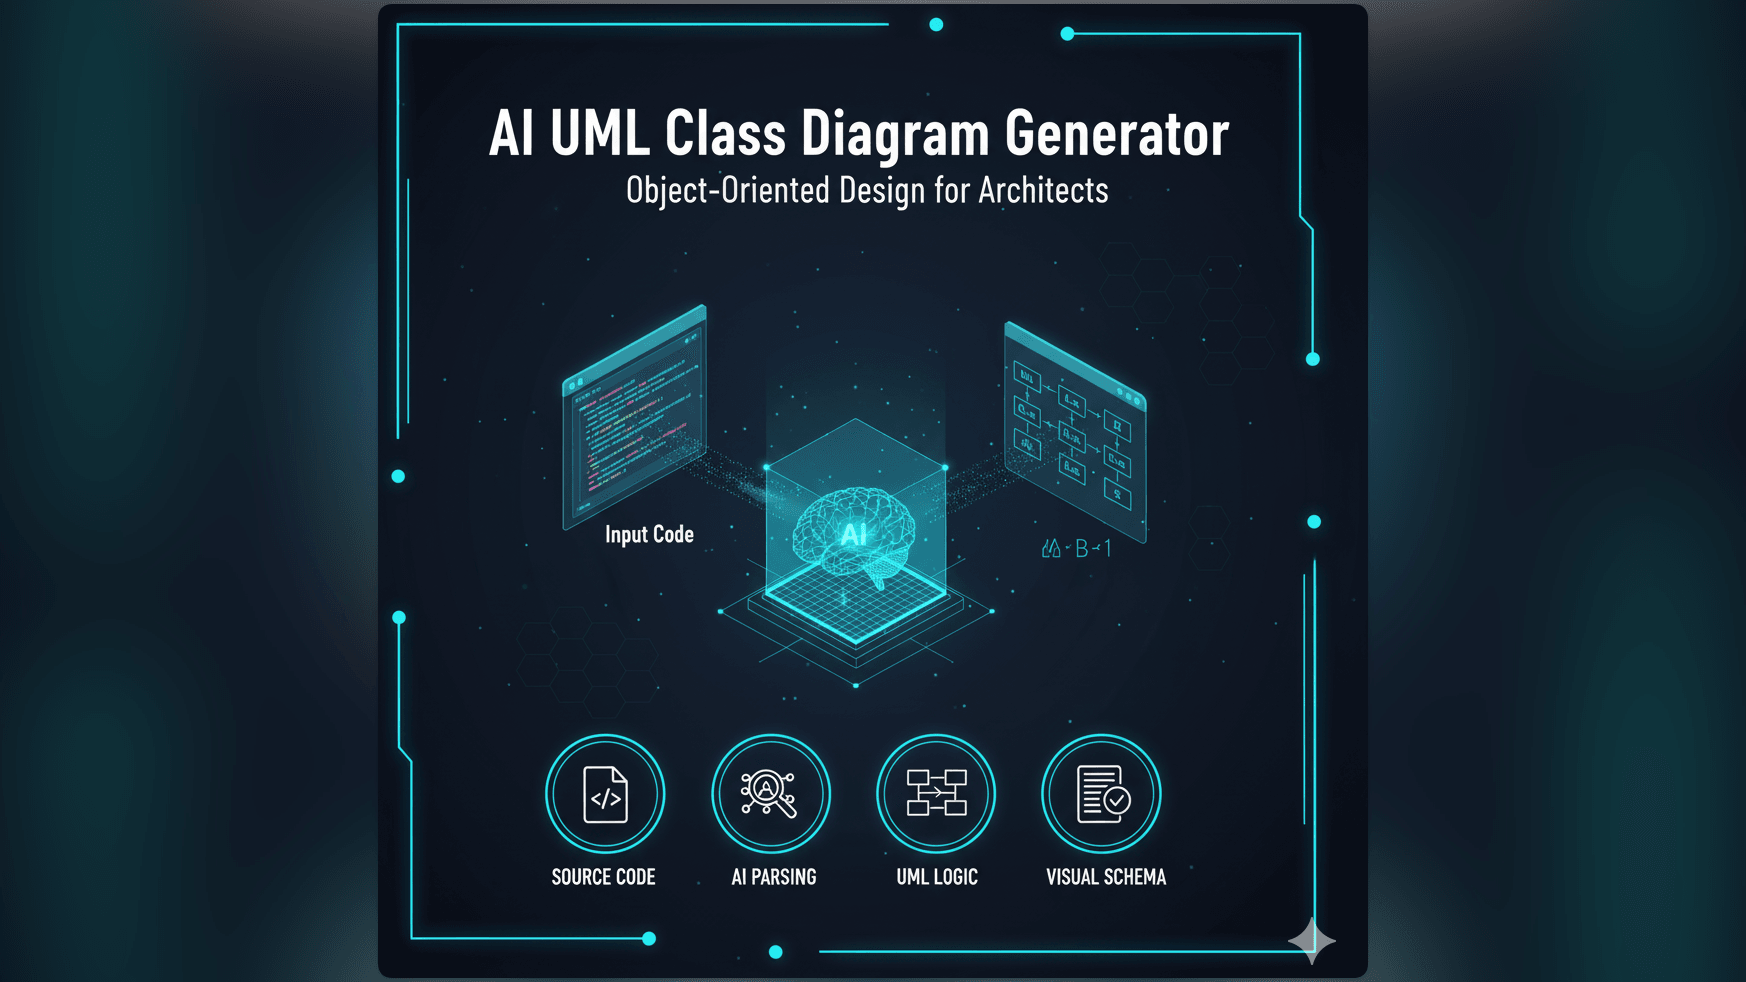
What types of diagrams can be generated from images? The AI is versatile but it excels at the diagrams we support natively: Flowcharts, Sequence Diagrams, ER Diagrams, UML Class Diagrams, and System Architecture Diagrams.
Is it possible to correct misinterpretations by the AI? Yes. Sometimes the AI might think a messy “O” is a “0” or it might miss a faint line. You can fix these easily. You can either manually edit the element or just tell the AI via chat “Connect the Login box to the Database box” and it will draw the missing line for you.
This guide: The Developer’s Guide to AI Diagramming: goes deeper into the overall philosophy of AI diagramming, but if you have a whiteboard full of ideas right now, take a picture. It is the fastest way to save them.