· Frontend · 4 min read
Visualizing React Component Hierarchies from Code
This guide explains how to use AI Diagram Maker to visualize your React component hierarchy instantly by simply copying your code to manage modern frontend state.

Frontend development has exploded in complexity.
Five years ago a webpage was HTML and a bit of jQuery. Today a modern React application is a massive tree of thousands of components.
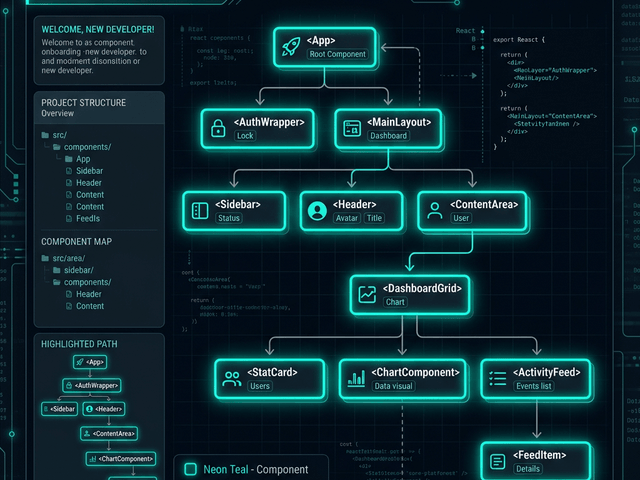
You have the App component which holds the Router which holds the Layout which holds the Navbar and the Dashboard which holds the Sidebar and the WidgetGrid.
Navigating this tree in your head is hard. Navigating it by jumping between files in VS Code is disorienting.
You forget who owns the state. “Does the UserContext live in the Header or the App?” “Why is the Button re-rendering when I type in the SearchInput?”
To solve these problems you need to see the tree. You need a React Component Diagram.
This guide explains how to use AI Diagram Maker to visualize your component hierarchy instantly by simply copying your code.
The Complexity of Modern Frontend State
React is built on a strict hierarchy. Data flows down. Events bubble up.
Prop Drilling vs. Context API vs. Redux
The biggest architectural challenge in React is managing state.
If you pass data from a Grandparent to a Parent to a Child that is Prop Drilling. It creates tight coupling.
If you use Context you bypass the middle layers. But this creates invisible dependencies.
Without a visual map of the tree it is hard to see these paths. You might accidentally drill props through five layers of components that don’t even use them just to get data to a button at the bottom.
Losing track of Parent-Child relationships
When you look at a file like Dashboard.tsx you see the imports. You know it imports Widget.
But you don’t see the whole tree. You don’t see that Dashboard is actually a child of AuthGuard. This lack of context makes refactoring risky. You might move a component and accidentally break the authentication logic.
Mapping React Code to Tree Diagrams
We treat your React code as the source of truth for the diagram.
Nodes = Components
In our diagrams every React Component becomes a box (a Node). function Header() { ... } becomes the Header box.
Edges = Imports / Usage
The connections (Edges) represent usage. If App renders <Header /> we draw an arrow from App to Header.
This creates a directed graph. It shows you the exact structure of your UI.
Workflow: From App.tsx to Visual Tree
Here is how to get this view for your project.
Copying component definitions
Open your main application file. This is usually App.tsx or your main Routes.tsx file. Copy the JSX/TSX code.
Note: You don’t need the CSS or the logic inside useEffect. You just need the render function where the child components are used.
Generating the hierarchy diagram
Paste it into AI Diagram Maker. Use a prompt like: “Visualize the component hierarchy based on this JSX.”
The AI parses the JSX structure. It recognizes that <Navbar /> is nested inside <Layout>. It draws the tree.
You can paste multiple files to build a larger map. Paste your Dashboard.tsx code to expand that branch of the tree.
Analyzing the Tree for Optimization
Once you have the visual you can spot performance issues.
Identifying re-render bottlenecks
Look at the diagram. Find the components that hold heavy state.
If your App component holds a state variable that updates on every keystroke and it connects to fifty child components then every keystroke causes the entire app to re-render.
The diagram makes this “Fan Out” obvious. You can visually identify where you need to push state down or wrap components in React.memo.
Spotting circular dependencies
Sometimes you end up with a mess where Component A imports Helper B which imports Component A. This causes build errors and runtime crashes.
In code this is hard to spot. In a diagram it shows up as a cycle. An arrow points back up the tree. Seeing this visual loop allows you to fix the architecture immediately by extracting the shared logic into a separate hook or utility.
Visualizing your React tree brings order to the chaos of frontend development. It turns your file system into a map.