· Database Management · 3 min read
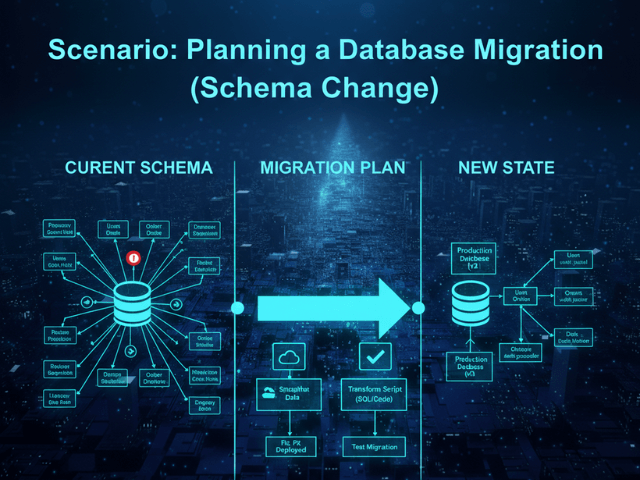
Scenario: Planning a Database Migration (Schema Change)
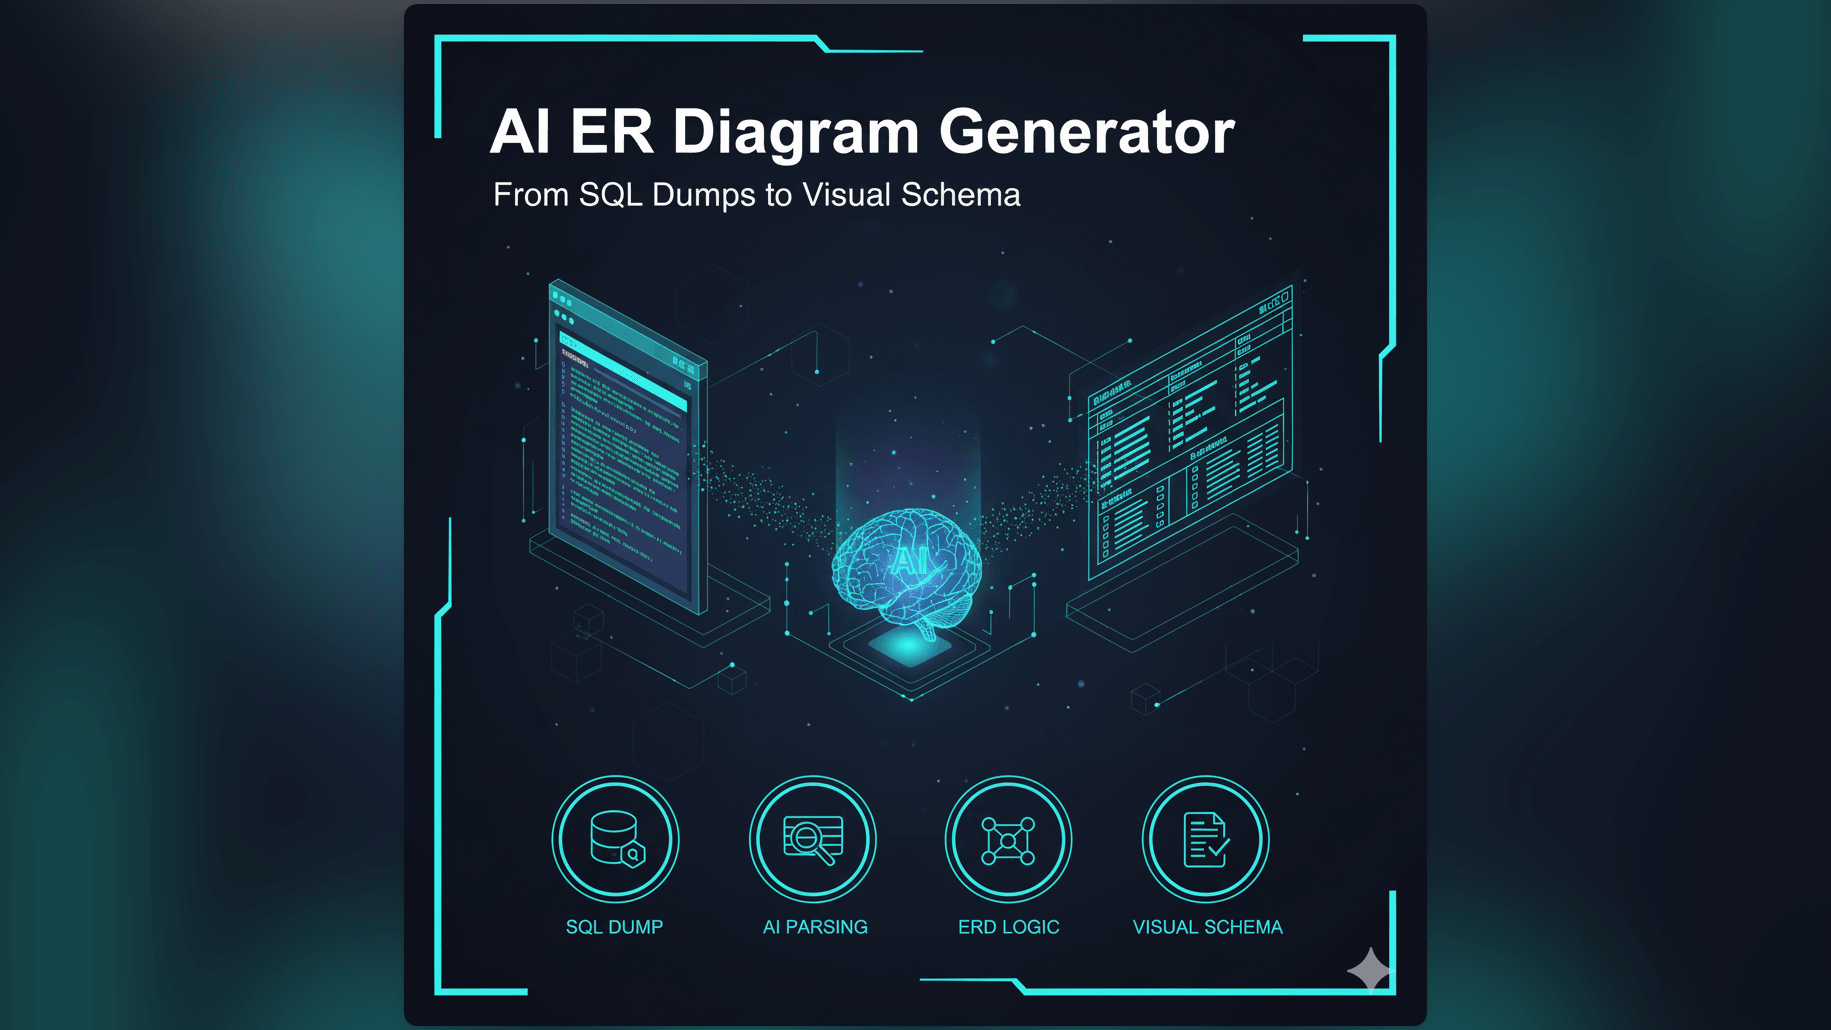
This scenario details how to use AI-generated ER diagrams to visually plan and verify critical database schema changes, ensuring data integrity during complex migrations.
Data migrations are terrifying. If you deploy a bug in your code you can rollback. You deploy the previous version and everything is fine. If you deploy a bug in your database migration you corrupt the data. You lose user records. Rolling back is a nightmare that involves restoring from backups and losing hours of transactions. So when you are planning a major schema change like splitting the Users table into Users and Profiles you want to be absolutely sure you got it right. You write the SQL migration script. You stare at it. ALTER TABLE users DROP COLUMN bio;. Is that right? Did you move the data first? Is the foreign key set up correctly on the new table? Reading the SQL isn’t enough. You need to verify the structure visually.
The Situation: Moving from V1 to V2 Schema
You have the current production schema (V1). It works but it is messy. The Users table has 50 columns. You have designed the new schema (V2). It is clean. It is normalized. But the path from V1 to V2 is dangerous. You need to convince your team (and yourself) that the new relationship model actually supports all the old queries.
The Goal: Ensure No Data Loss
You want to compare “Before” and “After” side-by-side. You want to verify the Cardinality. Is it truly a One-to-One relationship between User and Profile? You want to verify the keys. Did you remember to add the user_id foreign key to the Profiles table? If you forgot you will have orphaned records.
The Workflow:
Here is how AI Diagram Maker acts as your safety net.
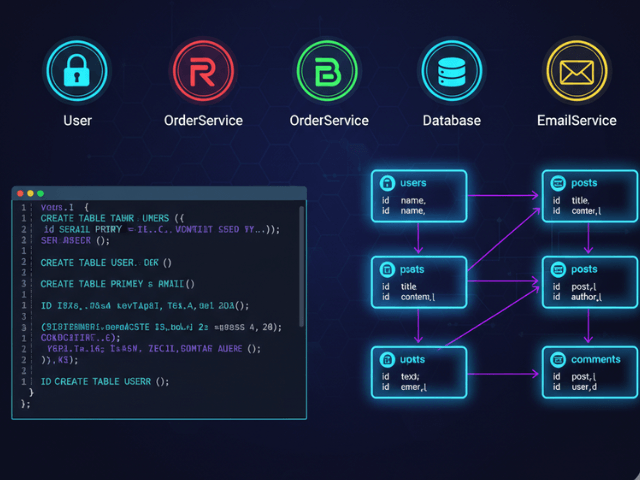
Importing the V1 SQL Dump
First you dump the current schema. pg_dump -s. You paste it into the tool. You generate the ER Diagram. You see the massive V1 Users table.
Modifying text to prototype V2
Now you don’t write the migration code yet. You edit the definition in the tool. You delete the bio and address columns from the Users block. You create a new Profiles block. You draw a line connecting them. You look at the generated V2 diagram. “Wait,” you think. “I put the foreign key on Users. It should be on Profiles.” The diagram showed the relationship backwards. You caught the bug visually before writing the SQL.
The Result: Verified Keys and Relationships
You fix the definition. You generate the correct V2 diagram. Now you write your SQL migration script to match the diagram. You attach the “After” image to your Pull Request. Your reviewer looks at the code then looks at the diagram. “Looks solid. The relationship direction makes sense.” You deploy with confidence.
Import your SQL. Don’t migrate in the dark. Use AI Diagram Maker to validate your schema changes visually before you run them. It is cheaper than fixing corrupted data.
The Programmable Diagram: A Developer’s Guide to D2 and Text-Based Visuals
For more on visualizing data structures and schemas, check out our guide: The Programmable Diagram: A Developer’s Guide to D2 and Text-Based Visuals.