· Glossary · 4 min read
What Is a Process Flow Diagram (PFD)?
A Process Flow Diagram (PFD) is a visual map that illustrates the relationships between major components in a system and the sequence of steps in a workflow. Learn how PFDs clarify business logic and identify bottlenecks.
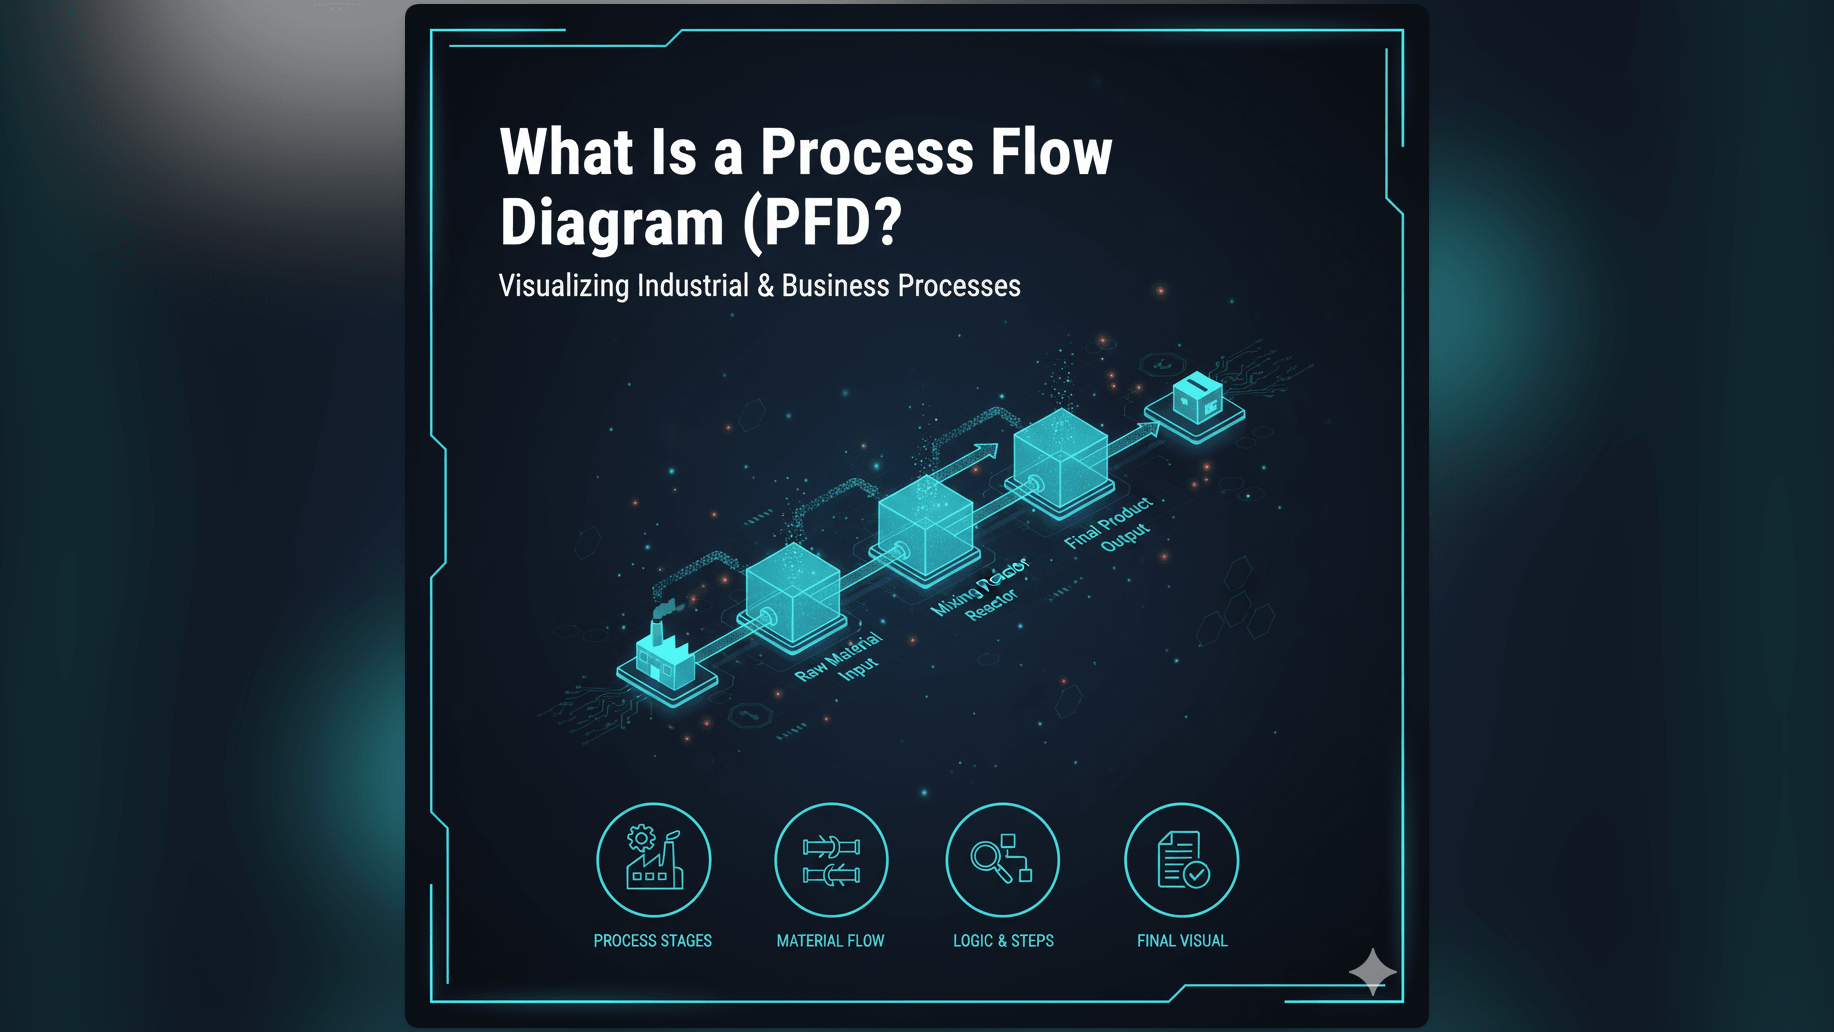
In both software engineering and industrial design, understanding how a system moves from A to B is critical. A Process Flow Diagram or PFD is the map that visualizes this journey.
Simple Definition of a Process Flow Diagram
A Process Flow Diagram is a type of flowchart that illustrates the relationships between major components in a system. It shows the flow of materials, data, or logic through a specific process.
While the term originated in chemical engineering to show how liquids move through pipes, it is now a standard term in business and software. In software development, it maps out the sequential steps a program takes to solve a problem.
Visualizing the Steps and Decisions in a Process
At its core, a PFD answers the question: “What happens next?” It uses standard symbols to represent different actions:
- Ovals usually indicate the Start and End points.
- Rectangles represent a specific Step or Operation.
- Diamonds represent a Decision Point where the flow splits based on a Yes or No condition.
- Arrows connect these shapes to show the direction of movement.
By following the arrows from top to bottom, you can trace the entire lifecycle of a task.
Why PFDs are Essential for Understanding Workflows
Processes that live in people’s heads are unreliable. One person thinks the approval step happens before the payment: another thinks it happens after. A PFD removes this ambiguity.
Clarifying Business Processes and System Logic
Standardization is the primary benefit. By documenting a workflow in a diagram, you create a “Standard Operating Procedure.”
For developers, this is often called logic mapping. Before writing a complex function, sketching a PFD ensures you have accounted for every possible logical path. It forces you to define exactly what happens when an error occurs or when an input is missing.
Identifying Bottlenecks and Optimization Opportunities
You cannot fix what you cannot see. When you layout a process visually, inefficiencies jump off the page. You might see a loop that repeats unnecessarily or a decision point that sends 90% of requests to a manual review step causing a backlog. The PFD allows teams to analyze the flow and find ways to streamline it.
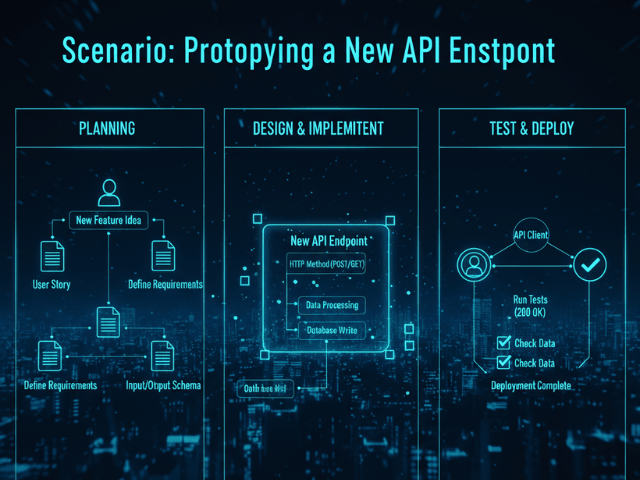
Real-World Example: A Simple Order Fulfillment PFD
Let’s imagine the backend logic for an online store. A PFD for “Order Fulfillment” helps the team understand the code requirements.
Illustrating Start, Steps, Decisions, and End Points
The flow starts with the Start Node: “Order Received.” An arrow points to the first Process Node: “Validate Payment.” Then comes a Decision Diamond: “Is Payment Successful?”
If No, the arrow points to a “Send Failure Email” step and then to the End. If Yes, the arrow points to the next step, “Check Inventory.” This might lead to another Decision Diamond: “Is Item in Stock?” Eventually, the successful path leads to the End Node: “Ship Package.”
Tracing this visual line guarantees that the developer builds a system that handles both success and failure states correctly.
How AI Diagram Maker Simplifies PFD Creation
Traditionally, creating these diagrams meant spending hours in drawing software. You had to drag every box and type every label manually.
Automated Generation of Flowcharts from Text Descriptions
With our AI Flowchart Maker, creating a PFD is instant. You can describe the process in natural language: “Create a process flow for order fulfillment. First check payment. If valid check stock. If in stock ship item.”
The AI interprets the sequence, selects the correct symbols, and routes the arrows. It generates a professional Process Flow Diagram from your text, allowing you to focus on optimizing the logic rather than aligning the shapes.
Related Terms
To fully utilize PFDs, it helps to understand these related concepts:
- Flowchart: The broader category of diagrams that PFDs belong to. Flowcharts can represent anything from algorithms to organizational charts.
- Business Process Modeling: The discipline of analyzing and improving business workflows, often using PFDs as a primary tool.
- Workflow: The sequence of industrial, administrative, or other processes through which a piece of work passes from initiation to completion.
- Decision Point: A specific moment in the flow where a choice must be made, usually resulting in a branching path.
- Process Mapping: The act of creating a PFD to document a current or future state of a system.
For more details on how to generate these diagrams automatically, visit our Developer’s Guide.