· Scenarios · 3 min read
Scenario: Preparing for a Security Audit
A practical scenario guide on preparing Data Flow Diagrams (DFDs) for a SOC2 security audit using AI flowchart makers.
The email arrived on Monday morning.
Our annual SOC2 audit was officially scheduled for the following week. As the CTO of a growing B2B startup I knew exactly what that meant. It was time for the “Great Documentation Scramble.”
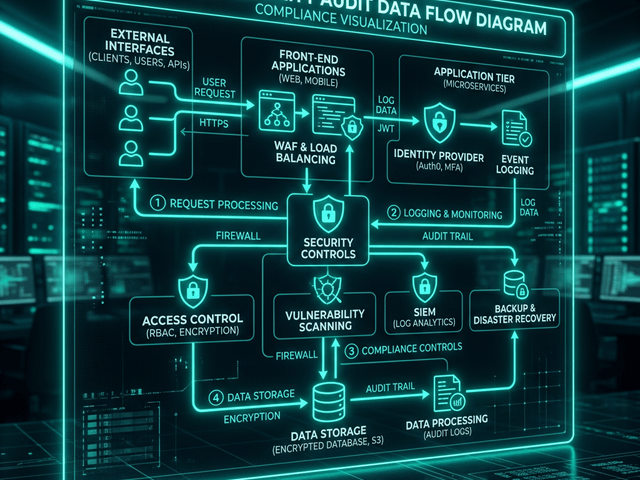
The auditor sent over a checklist of evidence. Item number four was the big one: “Current Data Flow Diagrams (DFD) showing the lifecycle of Personally Identifiable Information (PII) and Trust Boundaries.”
I checked our internal wiki. The last diagram was from fourteen months ago. Since then we had migrated our logging to a third party provider and added an asynchronous processing queue for user uploads.
If I handed that old diagram to the auditor it would be an immediate red flag. It would show that we don’t have control over our architectural changes.
But I didn’t have eight hours to spend fighting with a drag and drop drawing tool. I needed a professional compliance-ready visual by the end of the day.
The Challenge: Auditor needs a Data Flow Diagram (DFD)
A DFD is a specific type of flowchart. It doesn’t just show boxes; it shows where data is stored where it is processed and where it crosses into untrusted territory.
The auditor needs to see that we know exactly where the user’s email and encrypted password live. They need to see that we have a clear boundary between the public internet and our private database.
The Workflow:
I turned to AI Diagram Maker to handle the drafting while I focused on the accuracy of the data logic.
Mapping the flow of PII data
Instead of searching for “Cloud Icons” I opened the tool and started describing the path of a user registration.
“External Entity: User sends PII to Process: API Gateway. Process: API Gateway forwards to Process: Auth Service. Process: Auth Service saves data to Data Store: User Database. Process: Auth Service sends log event to Data Store: Logging Provider.”
The AI recognized the DFD keywords. It drew the rectangles for entities the circles for processes and the parallel lines for data stores.
Identifying encryption points
A good compliance diagram needs annotations. The auditor wants to see that data is encrypted.
I used the chat refinement to add the details.
“Add a label to the arrow between User and API Gateway saying ‘TLS 1.3’. Add a note to the User Database saying ‘AES 256 Encryption at Rest’.”
The diagram updated instantly. It placed the security labels exactly where they needed to be. I didn’t have to resize a single text box or realign a single arrow.
The Result: Compliance-ready visual evidence
Within thirty minutes I had a complete high resolution Data Flow Diagram.
It showed the new logging provider. It showed the trust boundary clearly marked around our virtual private cloud. It was accurate it was professional and most importantly it was up to date.
When the auditor sat down in our office the following week I handed over the SVG export. They looked it over for two minutes and moved to the next item. No follow up questions. No “Findings” regarding outdated documentation.
By using an AI flowchart maker specifically for data flow I saved myself a day of manual labor and secured our compliance status.
Start your audit prep. Don’t let compliance documentation become a bottleneck for your team. Use AI Diagram Maker to generate your Data Flow Diagrams in minutes. It is the fastest way to stay audit ready.