· Database · 3 min read
MongoDB Schema Visualization: Mapping Document Relationships
This guide explains how to use an AI-powered MongoDB schema visualizer to make your implicit schema visible, optimizing document structure and read performance.
“MongoDB is schemaless.”
That is the lie we tell ourselves when we start a project. It sounds liberating. You can just throw JSON documents into a collection and figure it out later.
But “later” always comes.
Six months in you realize you have three different versions of the User document. Some have an address string. Some have an address object. Some have no address at all.
You need to optimize a query but you don’t know the structure of the data. You need to join collections using $lookup but you don’t know the foreign key fields.
The truth is that every database has a schema. In SQL it is explicit. In NoSQL it is implicit.
This guide explains how to use an AI-powered mongodb schema visualizer to make that implicit schema visible.
The Myth of “Schemaless” Design
Just because the database doesn’t enforce rules doesn’t mean your application doesn’t rely on them.
Implicit schemas still exist and need documentation
Your code expects data to be in a certain shape. If the database returns something else the app crashes.
Documenting this expected shape is critical for team sanity. You need a map that says “A User document usually looks like this.”
Visualizing Documents vs. Tables
Visualizing NoSQL is different from SQL. We don’t have flat rows. We have trees.
Representing Nested Documents (Embedding)
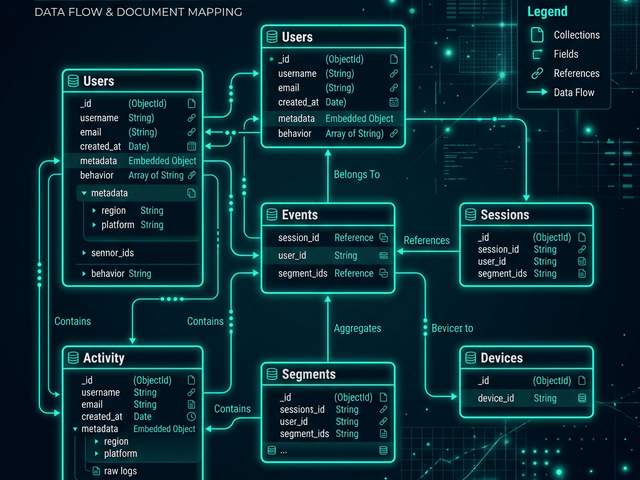
In MongoDB you often embed data. An Order document contains an array of Item objects.
Our visualizer represents this hierarchy. It draws the Order box. Inside it or connected to it it draws the Item structure. This visual distinction helps you understand the data locality. You can see that “Items” are part of the “Order” aggregate.
Representing ObjectIDs (References)
Sometimes you reference data. You store a customerId string that points to the customers collection.
Our tool recognizes these patterns. If it sees a field ending in Id that looks like a MongoDB ObjectID it draws a relationship line. This creates a hybrid diagram. It shows the nesting (for performance) and the linking (for relationships).
Using JSON to Generate the Model
Since MongoDB stores BSON/JSON we use that as the input.
Pasting sample documents to infer structure
You don’t paste a CREATE TABLE statement because it doesn’t exist. Instead you paste a sample document from your database.
Go to MongoDB Compass or Atlas. Copy one representative user document. Paste it into AI Diagram Maker.
Generating a Class-like diagram for Collections
The AI analyzes the keys and values. It infers the types.
It generates a diagram that looks like a Class Diagram. It lists the fields. It shows the arrays. If you paste samples from multiple collections (e.g. one User and one Post) the AI will try to connect them based on matching IDs.
Use Case: Optimizing for Read Performance
Why do you need this map? To make your app faster.
Visualizing when to Embed vs. Reference
The biggest design decision in MongoDB is “Embed or Reference?”
If you embed Comments inside the Post document reads are fast (one query). But if a Post has 50,000 comments you hit the document size limit.
By visualizing the schema you can spot these risks. “Look at this diagram,” you say to your team. “The Comments array is inside the Post box. That is dangerous for viral posts.”
The visual makes the architectural trade-off obvious. It allows you to refactor the schema moving Comments to their own collection before you have a production outage.
Visualizing your MongoDB schema turns a mess of JSON into a structured reliable data model.